Building Identity Analytics: Mining Authentication Logs for Insights
Learn how to build identity analytics by mining authentication logs with the ELK stack to detect anomalies and gain security insights.
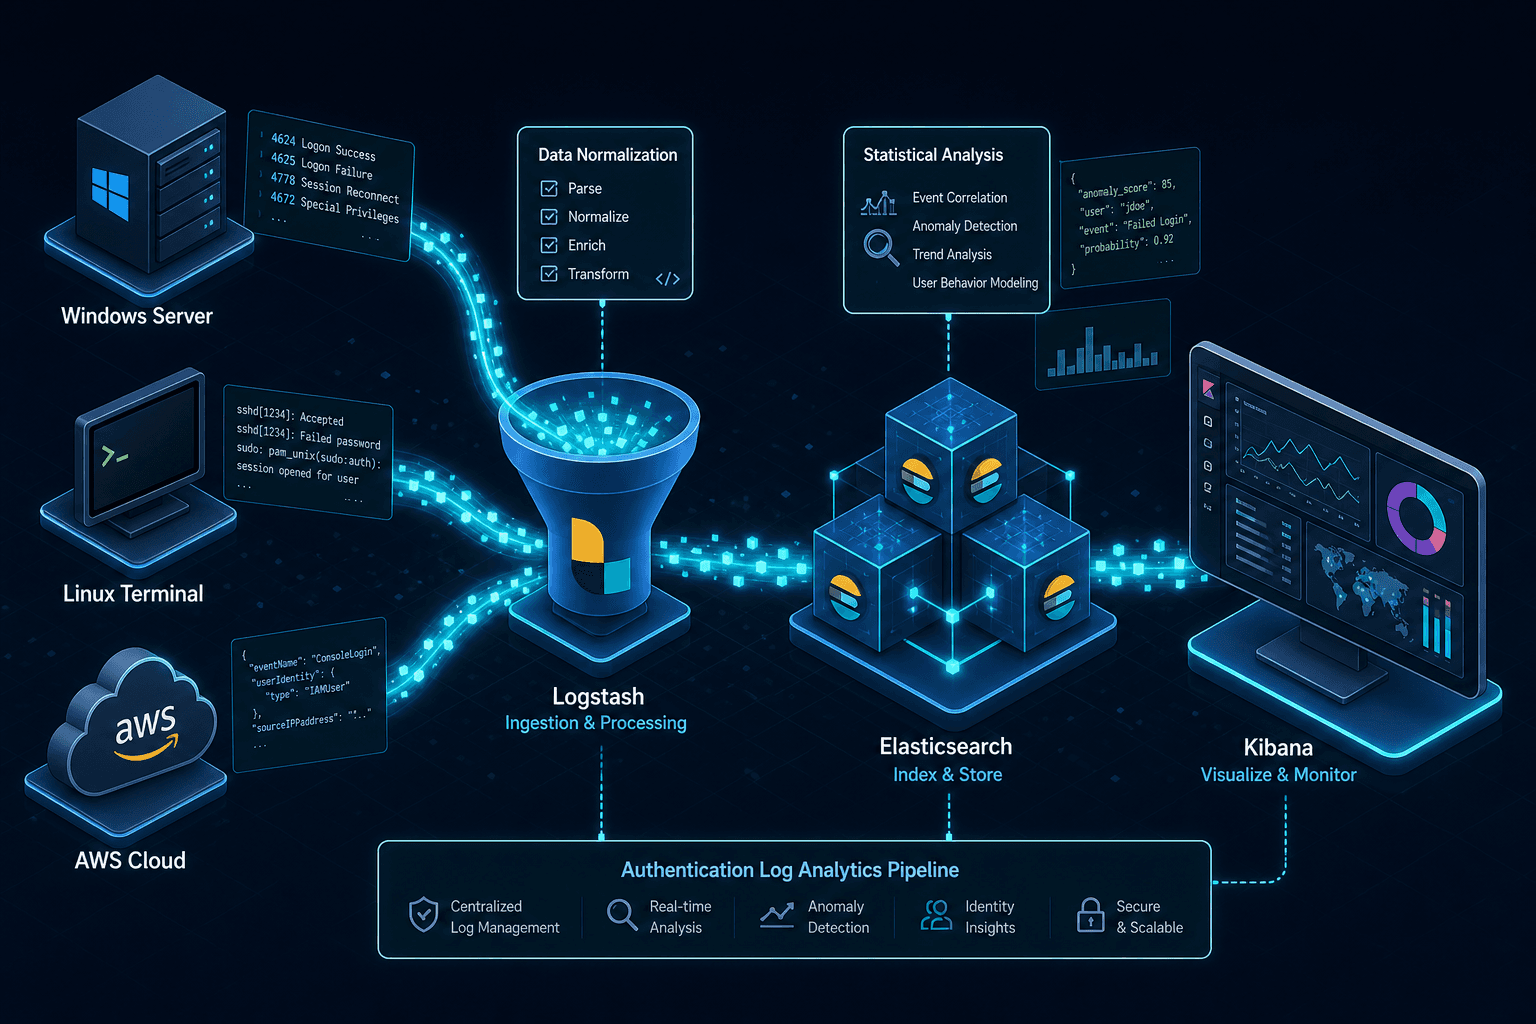
The core mechanism of identity analytics is not rule-based alerting but statistical deviation detection. Traditional security monitoring looks for known bad signatures, such as a specific malicious IP address. Identity analytics, conversely, constructs a behavioral baseline for every user identity and flags any action that statistically diverges from that baseline. This shift requires treating authentication logs not as isolated events but as a continuous stream of data points representing user intent and capability. To build this system, we must first standardize the ingestion of heterogeneous log sources, then construct a dynamic baseline, and finally apply statistical logic to detect anomalies.
Normalizing the Ingestion Pipeline
The first failure point in identity analytics is inconsistent log formatting. A Windows Server logs a failed login as Event ID 4625 with fields like TargetUserName and IpAddress, while an AWS CloudTrail entry might contain userIdentity and sourceIPAddress in a nested JSON structure. A Linux sshd log might appear as a plain text string: Accepted publickey for admin from 192.168.1.50 port 22. If these are indexed directly, the Elasticsearch query language cannot correlate "admin" across systems.
The mechanism here is schema normalization at the ingestion layer. We use Filebeat to tail the local log files and pipe them to Logstash for transformation. The critical step is the grok filter in Logstash, which parses unstructured text into structured fields. For example, a sshd log line is parsed into specific fields like log_source, user, ip, and auth_result.
filter {
  grok {
    match => { "message" => "%{SYSLOGTIMESTAMP:syslog_timestamp} %{SYSLOGHOST:host} %{DATA:application}: %{GREEDYDATA:message}" }
  }
  if [application] == "sshd" {
    grok {
      match => { "message" => "%{WORD:auth_status} %{USERNAME:user} from %{IP:source_ip} port %{NUMBER:port} %{GREEDYDATA:details}" }
    }
  }
  mutate {
    add_field => { "log_type" => "auth_linux" }
    rename => { "user" => "target_user" }
  }
}
This ensures that regardless of the source, the downstream Elasticsearch index contains a flat schema with target_user, source_ip, auth_status, and timestamp. Without this normalization, the subsequent aggregation steps fail because the query engine cannot group "admin" from Windows and "admin" from Linux together.
Constructing the Behavioral Baseline
Once the data is normalized, the system must learn what "normal" looks like for each identity. Hard-coding rules like "User X logs in at 9 AM" is brittle; users work from different time zones or travel. The mechanism for establishing a baseline is the calculation of statistical distributions over a rolling time window. We use Elasticsearch aggregations to compute the cardinality of source IPs, the frequency of logins per hour, and the geographic distribution of access points for a specific user.
Consider a user, "Alice", who typically logs in from three specific US-East IPs between 8 AM and 6 PM EST. We create an index pattern for auth-logs-* and run a date histogram aggregation. This generates a time-series of login counts. Simultaneously, we calculate the unique IP count (cardinality) for Alice per day.
GET /auth-logs-*/_search
{
  "size": 0,
  "query": { "term": { "target_user": "alice" } },
  "aggs": {
    "login_frequency": {
      "date_histogram": { "field": "@timestamp", "calendar_interval": "1h" }
    },
    "unique_ips": {
      "cardinality": { "field": "source_ip" }
    }
  }
}
The output of this query provides the raw data for the baseline. In a production environment, this is often automated via a daily job that writes these aggregated metrics to a separate user-baseline index. This index stores the mean and standard deviation of login frequency and the set of allowed IPs for each user.
Detecting Anomalies via Statistical Deviation
With a baseline established, the detection mechanism compares real-time log events against the stored statistical norms. The most effective method for general anomaly detection is the Z-score, which measures how many standard deviations a data point is from the mean. If Alice usually logs in 5 times a day (mean=5, std_dev=1), and she logs in 15 times in an hour, the Z-score is 10, triggering an alert.
However, identity attacks often involve subtle deviations that simple thresholds miss. For instance, "Impossible Travel" occurs when a user authenticates from London and then New York within 30 minutes. The mechanism here involves calculating the distance between two source_ip geolocations and dividing by the time delta. If the calculated speed exceeds a realistic threshold like 500 mph, the event is flagged.
In the ELK stack, this is implemented using Elasticsearch SQL or a Painless script within a watcher. The logic queries the user-baseline index for the user's historical average login location and compares it to the current event's location. If the distance is > 1000 miles and the time delta is < 1 hour, the system triggers a high-severity alert.
To implement the scoring logic within Elasticsearch, we use a script_metric aggregation that initializes state, maps individual documents to calculate distances, and reduces the results to a final score.
GET /auth-logs-*/_search
{
  "size": 0,
  "query": { "term": { "target_user": "alice" } },
  "aggs": {
    "impossible_travel_score": {
      "script_metric": {
        "init_script": "state.distances = [];",
        "map_script": "
          def lat = doc['geo_lat'].value;
          def lon = doc['geo_lon'].value;
          // Calculate distance from baseline location (stored in state)
          // Pseudocode: double d = haversine(lat, lon, state.baselineLat, state.baselineLon);
          state.distances.add(d);
        ",
        "reduce_script": "
          double maxDist = 0;
          for (double d : state.distances) {
            if (d > maxDist) maxDist = d;
          }
          // Return score based on threshold
          return (maxDist > 1000) ? 1 : 0;
        "
      }
    }
  }
}
While Elasticsearch SQL is powerful for querying, complex multi-step logic like impossible travel often requires a dedicated analytics engine or a custom script that joins the current event with historical geolocation data. The key is that the alert is not triggered by a specific IP, but by the relationship between the current event and the user's historical pattern.
Operationalizing the Insights
The final stage is turning these detections into actionable intelligence. A high volume of false positives will desensitize the security team. To mitigate this, the system must correlate the anomaly with other context. Did the user change their password recently? Is the source IP part of a known data center range (indicating a cloud attack) or a residential ISP (indicating a compromised personal device)?
We can enrich the data by appending WHOIS lookups or threat intelligence feeds (like AlienVault OTX) to the log entry before it hits the dashboard. If the source_ip resolves to a Tor exit node, the anomaly score increases automatically. This enriched data is visualized in Kibana using a heatmap of login locations overlaid with a time-series graph of failed attempts.
The dashboard should not just show "Alice failed login." It should show "Alice failed login 50 times from IP X (New York) in 2 minutes, while her baseline is 2 logins/day from IP Y (London)." This narrative is derived from the aggregation logic described earlier. The system effectively mines the logs to answer the question: "Is this behavior consistent with the user's historical pattern?" rather than "Does this match a known bad actor?"
By focusing on the mechanism of statistical deviation and normalization, identity analytics moves beyond simple log monitoring. It creates a dynamic, adaptive security posture that evolves as user behavior changes, making it significantly harder for attackers to blend in with legitimate traffic. The ELK stack provides the necessary infrastructure to handle the volume and velocity of authentication logs, but the value lies in the mathematical rigor applied to the data during the aggregation and comparison phases.
In practice, building this system requires a significant upfront investment in log normalization and baseline tuning. However, once operational, it provides a level of visibility into identity compromise that signature-based tools simply cannot achieve. The ability to detect a credential stuffing attack by observing the sudden spike in failed logins from a single user account, even if the credentials are valid, is the primary advantage of this approach.
Common Pitfalls
Implementing identity analytics introduces specific challenges that must be managed to maintain accuracy:
- Baseline Drift: User behavior naturally evolves over time. A static baseline will eventually flag legitimate new behaviors as anomalies. The system requires a mechanism for periodic baseline retraining or a rolling window that forgets older data.
- False Positives from Travel: Business travelers are the most common source of "impossible travel" alerts. Without context enrichment (e.g., checking for approved travel requests), the system may generate excessive noise, leading to alert fatigue.
- Log Ingestion Latency: If the pipeline from log generation to Elasticsearch indexing has high latency, the anomaly detection window shrinks. Real-time threats may be detected too late to prevent compromise if the delay exceeds the attack window.
Practical Takeaways
- Normalize First: Never attempt anomaly detection on raw logs. Invest heavily in the ingestion layer to ensure a unified schema before building aggregation logic.
- Context is King: An anomaly score is only useful when enriched with context. Always correlate login events with threat intelligence, user status, and network metadata.
- Iterate on Thresholds: Start with loose thresholds to capture data and tune sensitivity based on false positive rates. A perfect model is impossible; the goal is a manageable signal-to-noise ratio.
FAQ
Q: How often should the behavioral baseline be updated? A: Baselines should be updated continuously or on a daily basis using a rolling window. This ensures the system adapts to gradual changes in user behavior without being overly sensitive to temporary anomalies.
Q: Can I use the ELK stack alone for impossible travel detection? A: Yes, but it requires careful scripting. While Elasticsearch can calculate distances and time deltas, complex joins between current events and historical geolocation data often benefit from a dedicated analytics engine or a sophisticated Painless script.
Q: What is a good starting threshold for anomaly detection? A: Start with a Z-score threshold of 2 or 3 standard deviations. This captures significant deviations while filtering out minor noise. Adjust this based on your organization's tolerance for false positives versus missed detections.
Conclusion
Building identity analytics transforms raw authentication logs into a predictive security model. By normalizing heterogeneous sources, calculating statistical baselines, and applying deviation logic, organizations can detect subtle anomalies like impossible travel and credential stuffing that traditional signature-based tools miss. The ELK stack serves as the solid foundation for this pipeline, enabling the high-volume ingestion and complex aggregation required to maintain a dynamic, adaptive security posture.
Related posts
Building an Identity Data Lake: Analytics for Access Patterns
An examination of building an identity data lake to enable analytics for access patterns, security data lakes, identity analytics, and compliance reporting.
Building a Centralized Audit Log for Identity Events with ELK Stack
A walkthrough for building a centralized audit log for identity events using the ELK stack to ensure audit compliance and effective log management.
Building a Real-Time Identity Dashboard with Keycloak and Grafana
A guide to building a real-time identity dashboard using Keycloak and Grafana for monitoring authentication analytics and security metrics.