Building a Real-Time Identity Dashboard with Keycloak and Grafana
A guide to building a real-time identity dashboard using Keycloak and Grafana for monitoring authentication analytics and security metrics.
Most organizations treat their Identity and Access Management (IAM) system as a black box until a user complains about a login failure. By then, the logs are days old, buried in a rotating file system, and impossible to correlate with infrastructure metrics. To move from reactive support to proactive security observability, you must build a pipeline that extracts raw authentication events from Keycloak and streams them into a time-series database like Prometheus or Loki, visualized via Grafana. This architecture does not replace the Keycloak admin console; it augments it with real-time analytics, enabling you to detect brute-force attacks, measure authentication latency, and track client adoption instantly.
The fundamental problem with Keycloak's default monitoring is its storage model. By default, Keycloak records events in a relational database table named EVENT. While this is fine for auditing historical records, querying this table for real-time dashboards is inefficient and blocking. Every time the admin console loads a history view, it performs a heavy SQL scan on a growing table, often locking rows during high-traffic periods. Furthermore, the native UI only displays the last few hundred events, offering no mechanism for trend analysis or alerting on specific patterns like a spike in CLIENT_NOT_FOUND errors.
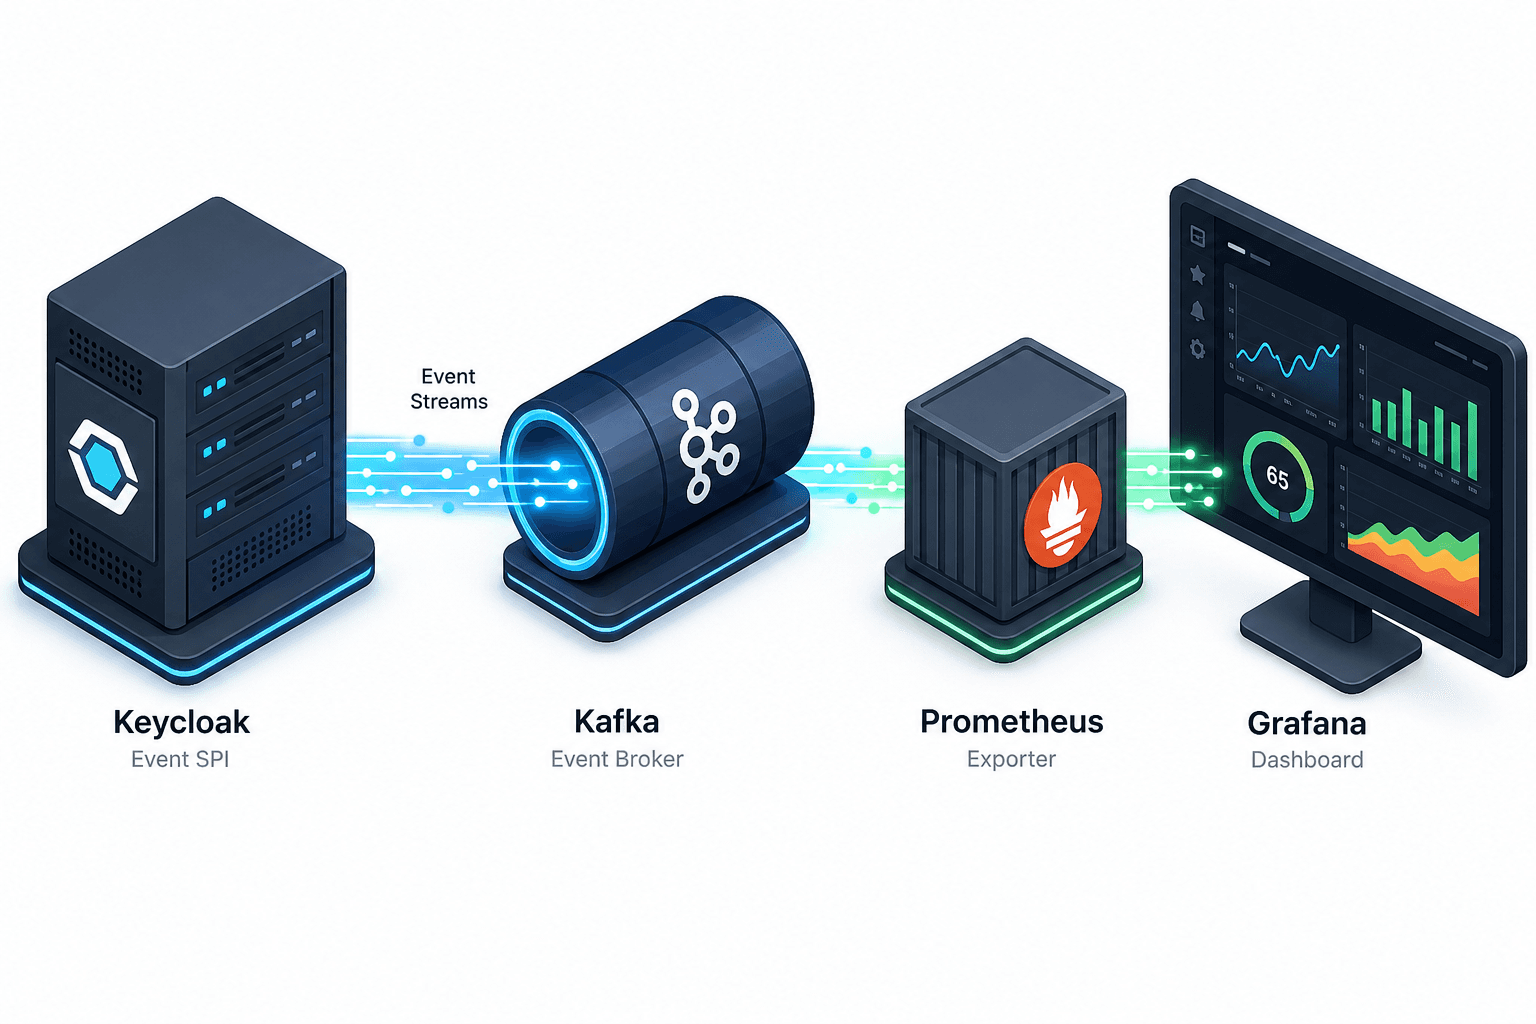
To solve this, we introduce an event streaming layer. Keycloak exposes a pluggable Event SPI (Service Provider Interface) that allows developers to intercept events as they occur. Instead of writing to the local DB, we configure a custom event handler to push these events to a message broker or a time-series database. The standard approach involves deploying the keycloak-event-log extension, which acts as a bridge between the Keycloak event bus and external systems.
Consider a scenario where AuthBot-01, a malicious script, attempts to brute-force the /auth/realms/myrealm/login-actions endpoint. In the default setup, this event sits in the EVENT table. With the event log extension enabled, the moment the LOGIN_ERROR event is generated, the extension serializes the event into a JSON payload containing the timestamp, IP address, client ID, error reason, and realm name. This payload is immediately pushed to a Kafka topic or an HTTP endpoint configured for a time-series collector.
The configuration for this pipeline happens in the standalone.xml (or standalone-ha.xml) file within the Keycloak server directory. You must define a new eventListener provider. For example, to route events to a Prometheus-compatible exporter, you would configure the kc_event_log module.
<subsystem xmlns="urn:jboss:domain:keycloak:2.0">
    <eventListeners>
        <listener name="prometheus-exporter" class="com.example.KeycloakPrometheusEventListener">
            <properties>
                <property name="url" value="http://prometheus-exporter:9090/"/>
                <property name="batchSize" value="100"/>
                <property name="flushInterval" value="5s"/>
            </properties>
        </listener>
    </eventListeners>
    <events>
        <listeners>
            <listener name="prometheus-exporter"/>
        </listeners>
        <admin-events enabled="true" user-detailed="false"/>
        <events enabled="true" admin-events-enabled="true"/>
    </events>
</subsystem>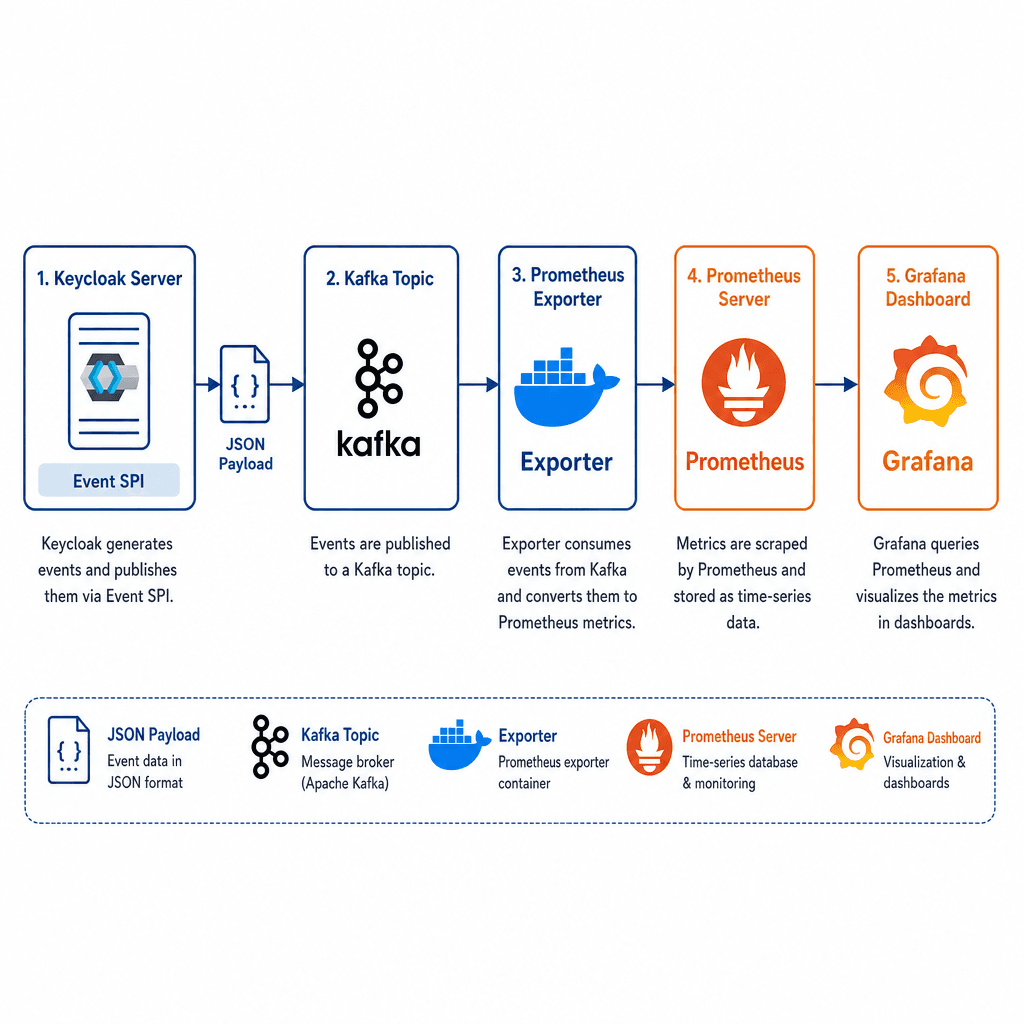
This configuration ensures that every authentication attempt, token refresh, and registration is captured. However, raw JSON events are not yet metrics. The next mechanism is metric translation. You need a component that consumes these events and converts them into Prometheus counters and histograms. This is typically handled by a sidecar container or a dedicated exporter service running alongside Keycloak.
The exporter receives the event stream (or subscribes if using a Kafka-based topology). When it receives a LOGIN_SUCCESS event, it increments a counter labeled with status="success", client="web-app", and realm="production". When it receives a LOGIN_ERROR with error="invalid_credentials", it increments a different counter. Crucially, you must map the event fields to Prometheus labels to enable filtering. For instance, the client_id field in the Keycloak event becomes the client label in Prometheus.
Once the data is in Prometheus, you can query it using PromQL. To find the number of failed logins in the last 5 minutes for a specific IP, you might write:
sum(rate(keycloak_login_errors_total{error="invalid_credentials"}[5m])) by (ip_address)This query returns a time series where each data point represents the rate of failed logins per second, aggregated by IP address. This is the raw fuel for your Grafana dashboard.
Now, we construct the Grafana dashboard. The goal is not to replicate the Keycloak UI, but to visualize the behavior of your identity system. You should create three primary panels.
The first panel is a "Security Heatmap." This visualizes the frequency of failed login attempts across different IP ranges over time. You configure a heatmap panel in Grafana using the PromQL query for keycloak_login_errors_total. The X-axis represents time (aggregated in 5-minute buckets), and the Y-axis represents the IP address (or a hashed version of it for privacy). The color intensity indicates the count of errors. If you see a vertical stripe of red, it indicates a concentrated attack from a single subnet. This is a pattern invisible in standard logs but immediate in a heatmap.
The second panel is a "Token Latency Scatter Plot." Authentication systems are often judged by their responsiveness. You want to see if token issuance is slowing down, which could indicate database contention or network latency. You configure a scatter plot using the histogram metrics exported from the event listener. The query calculates the 95th percentile latency for TOKEN_EXCHANGE events.
histogram_quantile(0.95, sum(rate(keycloak_token_latency_seconds_bucket[5m])) by (le))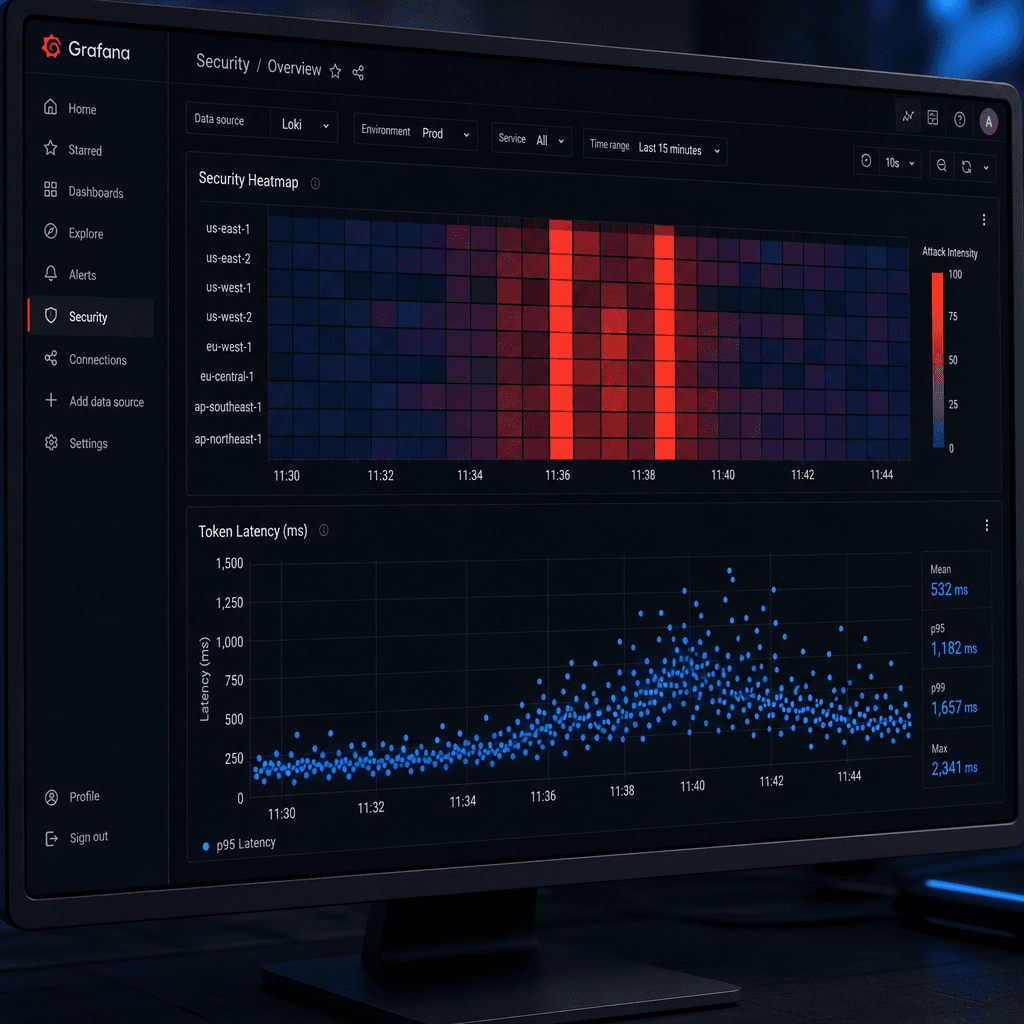
If the dots drift upward over time, you know the system is degrading before users complain. This allows you to correlate identity latency with infrastructure CPU usage or database I/O.
The third panel is a "Top Clients" bar chart. This helps you understand which applications are driving traffic. You aggregate the keycloak_login_success_total counter by the client label and sort by count descending. This panel answers the question: "Which app is causing the most load?" If a legacy application suddenly spikes, you can investigate its configuration immediately.
Opinion: While Grafana is excellent for visualization, do not rely solely on it for alerting. Use Prometheus Alertmanager to trigger PagerDuty or Slack notifications when specific thresholds are breached, such as a LOGIN_ERROR rate exceeding 100 per minute from a single IP. Grafana is for context; Alertmanager is for action.
Finally, ensure your data retention strategy is sound. Identity logs can grow rapidly. If you are using Loki, configure a retention policy of 30 days for high-resolution data and archive older data to cold storage. If using Prometheus, consider using Thanos or Cortex for long-term storage and federation. Without proper retention, your dashboard becomes a historical archive rather than a real-time tool.
By implementing this pipeline, you transform Keycloak from a static authentication provider into a dynamic observability node. You gain visibility into who is logging in, when, from where, and how fast the system responds. This level of detail is essential for modern security operations, allowing you to detect anomalies before they become breaches. The mechanism relies on the decoupling of event generation (Keycloak) from event processing (Exporter) and event storage (Time-Series DB), creating a resilient and scalable monitoring architecture.
The result is a dashboard that doesn't just show numbers, but tells the story of your identity ecosystem in real-time. You can see the impact of a new deployment, the effectiveness of a password policy change, or the onset of an attack within seconds of it happening. This is the standard for secure, observable identity management in production environments.
Conclusion
Building a real-time identity dashboard with Keycloak and Grafana requires shifting from static log analysis to dynamic event streaming. By leveraging the Keycloak Event SPI to feed structured data into a time-series database, you unlock the ability to visualize security threats, performance bottlenecks, and usage patterns as they happen. This architecture transforms your IAM system from a passive gatekeeper into an active, observable component of your infrastructure, ensuring that security and performance remain top priorities in your operational workflow.
FAQ
Does this impact Keycloak performance?
Yes, any event processing adds overhead. However, the kc_event_log extension is designed to be asynchronous. By batching events and using efficient serialization, the impact on authentication latency is typically negligible (under 1ms) unless you are processing millions of events per second.
How do I handle event serialization latency? If your event volume is extremely high, consider using a message broker like Kafka as an intermediate buffer rather than direct HTTP POSTs. This decouples the ingestion rate from the processing rate, allowing the exporter to consume events at its own pace without dropping data during spikes.
Can I use this with Loki instead of Prometheus? Absolutely. The event stream format remains the same (JSON). You would simply configure the exporter to push data to Loki's ingestion endpoint and use LogQL in Grafana instead of PromQL to query the logs.
Practical Takeaways
- Decouple event generation from processing: Never rely on the Keycloak database for real-time monitoring; offload events immediately to a time-series database or message broker.
- Map event fields to Prometheus labels explicitly: Ensure your exporter correctly translates Keycloak event fields (like
client_id) into Prometheus labels to enable granular filtering. - Use Alertmanager for thresholds, not just Grafana: Let Grafana provide context and history, but rely on Alertmanager to trigger immediate actions when critical thresholds are breached.
Common Pitfalls
- Ignoring event serialization overhead: Failing to batch events can overwhelm the exporter and the Keycloak event bus, leading to dropped events or increased latency.
- Hardcoding URLs in config instead of using environment variables: Embedding internal service URLs directly in
standalone.xmlmakes the deployment brittle and difficult to manage across different environments. - Failing to rotate event log keys: If your exporter relies on authentication keys for the ingestion endpoint, neglecting rotation policies can lead to security vulnerabilities if keys are leaked.
Related posts
Building Identity Analytics: Mining Authentication Logs for Insights
Learn how to build identity analytics by mining authentication logs with the ELK stack to detect anomalies and gain security insights.
Identity-Driven Kubernetes Access: Beyond RBAC with Gatekeeper and Kyverno
An examination of identity-driven Kubernetes access management using OPA Gatekeeper and Kyverno for enhanced policy-as-code security.
The Role of Identity in DevSecOps: Integrating Security into the Pipeline
An examination of identity management within DevSecOps to ensure secure CI/CD pipelines through code signing and secure security integration.