Spring Security and OpenTelemetry: Observability for Security Events
An examination of integrating OpenTelemetry with Spring Security to enable distributed tracing and security metrics for advanced observability.
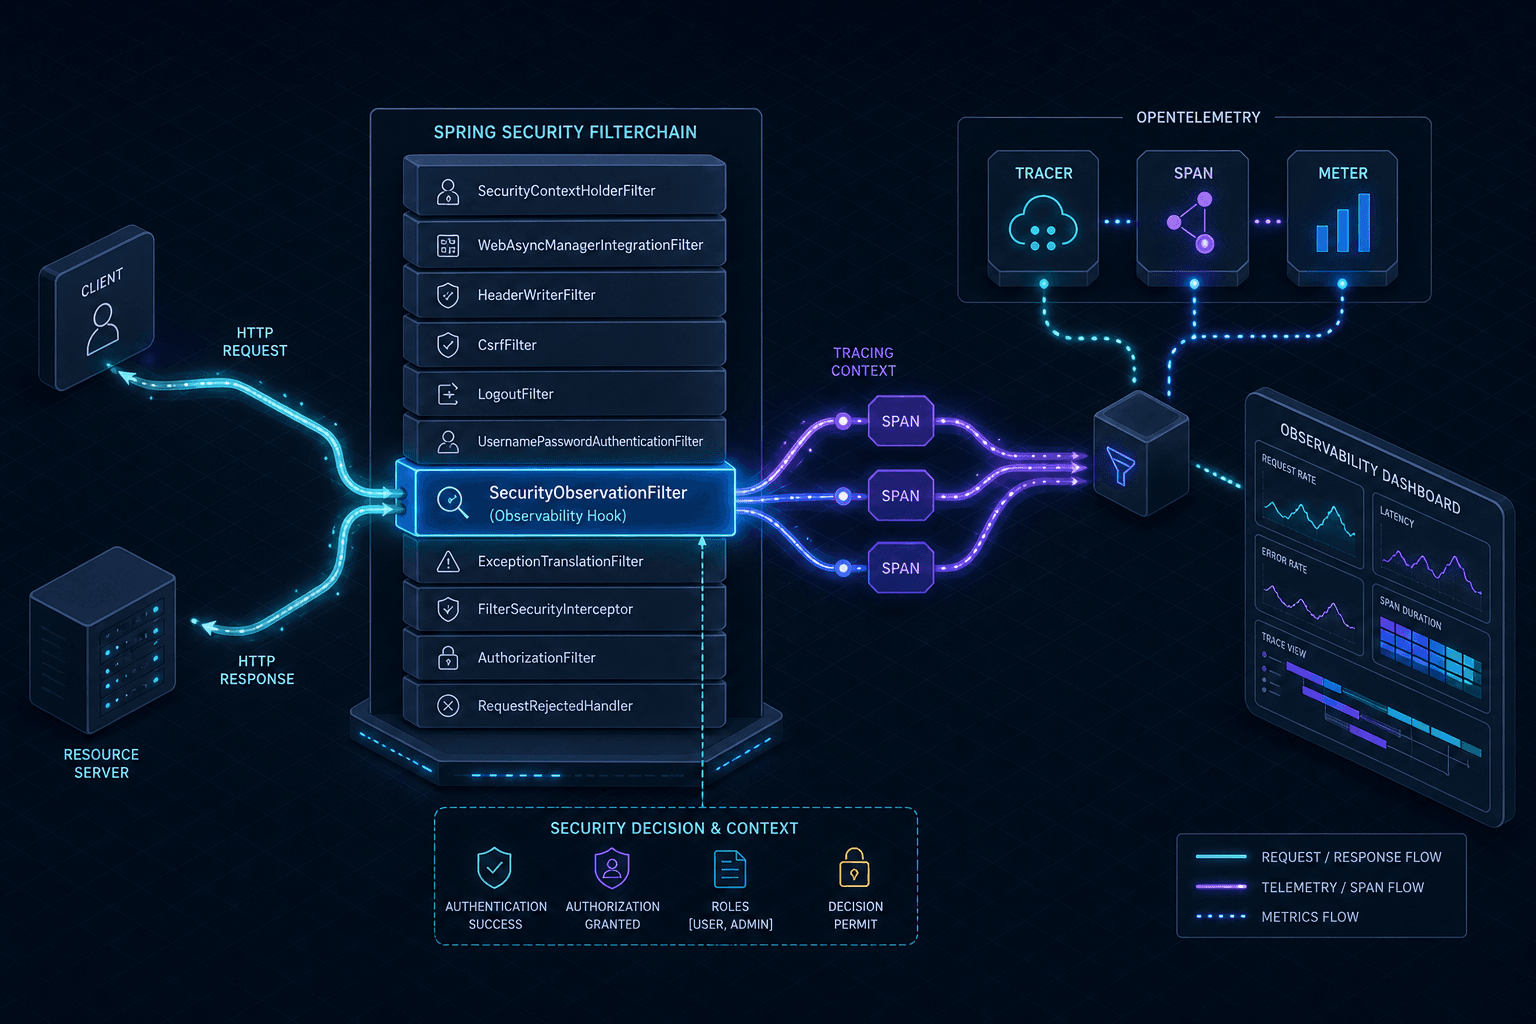
This article examines how to integrate OpenTelemetry with Spring Security to enable distributed tracing and security metrics for advanced observability. In a standard Spring Boot application, the request lifecycle flows from the servlet container through a chain of filters to a controller. Spring Security sits at the head of this chain as a OncePerRequestFilter. When you integrate OpenTelemetry, you inject a tracing mechanism directly into this filter's decision logic. The core mechanism is intercepting the doFilter method within the SecurityFilterChain. Without this interception, a request denied at the security layer never generates a trace span reflecting the security event itself.
Consider a scenario where an actor, Alice, attempts to access /admin/dashboard using an expired token. The JwtAuthenticationFilter detects the expiration and throws an ExpiredJwtException. In a vanilla setup, this results in a 401 response. In an observability-integrated setup, the OpenTelemetry Tracer must capture this failure before the exception propagates up the stack. We achieve this by wrapping the chain.doFilter(request, response) call inside a span created specifically for the security check. While manual interception provides granular control, agent-based alternatives like the OpenTelemetry Java Agent also exist to instrument these chains without modifying code directly.
The Mechanism of Interception
The critical mechanism in this snippet is the try-finally block surrounding the filterChain.doFilter call. If the security check fails, the exception is caught, the span status is explicitly set to ERROR, and specific attributes are added before re-throwing. This ensures that the distributed trace graph contains a node representing the security decision, even if the downstream controller is never reached. Without the finally block, the span might remain unclosed if an exception bubbles up to the servlet container before the span is explicitly terminated, breaking the correlation ID chain and preventing the exporter from flushing the incomplete data.
@Bean
public SecurityFilterChain securityFilterChain(HttpSecurity http, Tracer tracer) throws Exception {
    return http
        .addFilterBefore(new SecurityObservationFilter(tracer), UsernamePasswordAuthenticationFilter.class)
        .authorizeHttpRequests(auth -> auth.anyRequest().authenticated())
        .build();
}

class SecurityObservationFilter extends OncePerRequestFilter {
    private final Tracer tracer;

    public SecurityObservationFilter(Tracer tracer) {
        this.tracer = tracer;
    }

    @Override
    protected void doFilterInternal(HttpServletRequest request, HttpServletResponse response, FilterChain filterChain)
            throws ServletException, IOException {

        String operationName = "security.check";
        Span span = tracer.spanBuilder(operationName)
                .setParent(SpanContext.fromContext(Context.current()))
                .startSpan();

        try {
            // Inject trace context into the request attributes if needed for downstream filters
            Context context = Context.current().with(span);
            Context previousContext = context.attach();

            try {
                filterChain.doFilter(request, response);
                span.setStatus(StatusCode.OK);
            } finally {
                context.detach(previousContext);
            }
        } catch (Exception e) {
            // Capture the exception in the span to distinguish between
            // a 500 error and a security denial
            span.recordException(e);
            if (e instanceof AccessDeniedException) {
                span.setAttribute("security.authorization.result", "denied");
                span.setAttribute("security.reason", e.getMessage());
            }
            span.setStatus(StatusCode.ERROR, e.getMessage());
            throw e;
        } finally {
            span.end();
        }
    }
}
Context Propagation in Failure Scenarios
Once the span is active, we must enrich it with semantic data that defines who and why. The OpenTelemetry semantic conventions suggest specific attribute keys for security events. We extract the Authentication object from the SecurityContextHolder and map it to the span. However, we must be careful not to log the raw principal string if it contains PII. Instead, we log the role or the authentication provider.
Authentication auth = SecurityContextHolder.getContext().getAuthentication();
if (auth != null && auth.isAuthenticated()) {
    span.setAttribute("security.subject", auth.getName());
    span.setAttribute("security.auth.provider", auth.getAuthenticationManagerName());

    // Map roles to a simple list of strings for aggregation
    List<String> roles = auth.getAuthorities().stream()
        .map(GrantedAuthority::getAuthority)
        .collect(Collectors.toList());
    span.setAttribute("security.roles", roles);
} else {
    span.setAttribute("security.subject", "anonymous");
}
This enrichment allows you to query traces by security.subject or security.roles. For example, you can run a query to find all traces where security.authorization.result was "denied" and security.roles included "ADMIN". This is far more powerful than standard access logs because the trace ID links the failed authorization attempt to the upstream service that generated the request, the latency of the check, and the downstream services that might have been bypassed.
Enriching Spans with Security Attributes
Beyond tracing, we need to aggregate these events into metrics. The MeterProvider should be configured to listen for specific security outcomes. We can use a custom Observer or simply hook into the span attributes to increment counters. For advanced observability, we want to know the rate of 401s versus 403s over time.
// Conceptual implementation of metric recording within the filter
if (span.isRecording()) {
    // Ensure we have a Meter available via Global OpenTelemetry
    Meter meter = GlobalOpenTelemetry.getMeterProvider().get("spring-security-observability");

    // Increment a counter for access denied
    if (e instanceof AccessDeniedException) {
        meter.counterBuilder("security.access_denied")
            .setDescription("Count of access denied events")
            .build()
            .add(1); // In a real implementation, use async callbacks or instrumentation libraries
    }
}
Opinion: While custom instrumentation in the filter works, it introduces tight coupling between your security logic and your observability infrastructure. A more maintainable approach, though slightly more complex to configure initially, is to use the OpenTelemetry Java Agent or the Spring Cloud Sleuth integration which automatically instruments the SecurityFilterChain if configured correctly. However, for granular control over what constitutes a "security event" versus a generic error, manual instrumentation in the filter (as shown above) provides the necessary precision.
Finally, we must ensure that the trace context is propagated even when the request is rejected. The span lifecycle must be managed explicitly by the filter's finally block, independent of the HTTP response stream state. The mechanism of explicitly ending the span in the finally block guarantees that the trace data is flushed to the exporter regardless of the HTTP response state. This ensures that your monitoring dashboards show the full lifecycle of the attack or the failed login attempt, including the time spent in the JwtAuthenticationFilter versus the time spent in the network.
Metrics and Aggregation
The resulting observability landscape allows you to answer questions like: "Which user role is triggering the most 403 errors?" or "Is the JWT validation step causing latency spikes during peak load?" By treating security checks as first-class citizens in the distributed trace, you transform security from a black box into a visible, measurable component of your system's performance.
Conclusion
Integrating OpenTelemetry with Spring Security requires intercepting the FilterChain at the mechanism level to correlate security decisions (authentication/authorization) with distributed trace contexts, transforming abstract security events into actionable trace spans and metrics. This approach ensures that security failures are not invisible gaps in your observability stack but are instead rich data points available for root cause analysis and performance tuning.
Common Pitfalls
When integrating Spring Security with OpenTelemetry, developers often encounter specific pitfalls that can compromise data integrity or system performance. First, PII Leakage is a critical risk; logging the raw username or email directly into span attributes without anonymization can violate compliance regulations like GDPR. Second, Performance Overhead can occur if the instrumentation logic is too heavy, particularly if complex attribute extraction happens synchronously within the critical request path. Third, Context Propagation Failures frequently happen when exceptions are swallowed or filters are bypassed, causing the trace context to be lost before the span is closed, resulting in broken trace graphs.
Practical Takeaways
To successfully implement observability for security events, focus on these actionable steps:
- Inject Dependencies Early: Pass the
TracerandMeterProviderdirectly into your custom filter constructor to avoid static lookups and ensure testability. - Explicit Span Management: Always wrap
filterChain.doFilterin atry-finallyblock to guaranteespan.end()is called, even when exceptions occur. - Sanitize Attributes: Before adding any user-related data to spans, strictly validate and sanitize inputs to prevent PII leakage in your observability backend.
FAQ
Q: Can I rely solely on the OpenTelemetry Java Agent instead of writing a custom filter? A: Yes, the Java Agent can automatically instrument standard Spring Security filters, but it offers less control over specific security attributes compared to manual instrumentation. You may need to configure the agent to recognize custom security events.
Q: Why do I see 401 errors missing from my traces?
A: This usually indicates that the span was not closed before the exception bubbled up to the servlet container. Ensure your finally block explicitly calls span.end() regardless of whether an exception was thrown.
Q: How do I track security metrics without modifying the production code further? A: You can use the OpenTelemetry SDK's built-in metrics capabilities within your existing filter or configure the Java Agent to export metrics based on existing span attributes, though manual instrumentation offers the most precise control.
Related posts
SecurityFilterChain in Spring Security 6
A technical walkthrough of configuring SecurityFilterChain in Spring Security 6 using the Lambda DSL and RequestMatchers for Java developers.
Building a Custom Authentication Provider in Spring Security
This article covers the implementation of a custom authentication mechanism within Spring Security using a dedicated AuthenticationProvider.
Building a Custom UserDetailsService with Spring Security
Learn how to implement a custom UserDetailsService in Spring Security to handle user loading and GrantedAuthority logic.