CloudTrail, CloudWatch, and GuardDuty: Who Does What
Understand the distinct roles of CloudTrail, CloudWatch, and GuardDuty in AWS security and monitoring architecture.
Part 1 of the AWS Security Observability series.
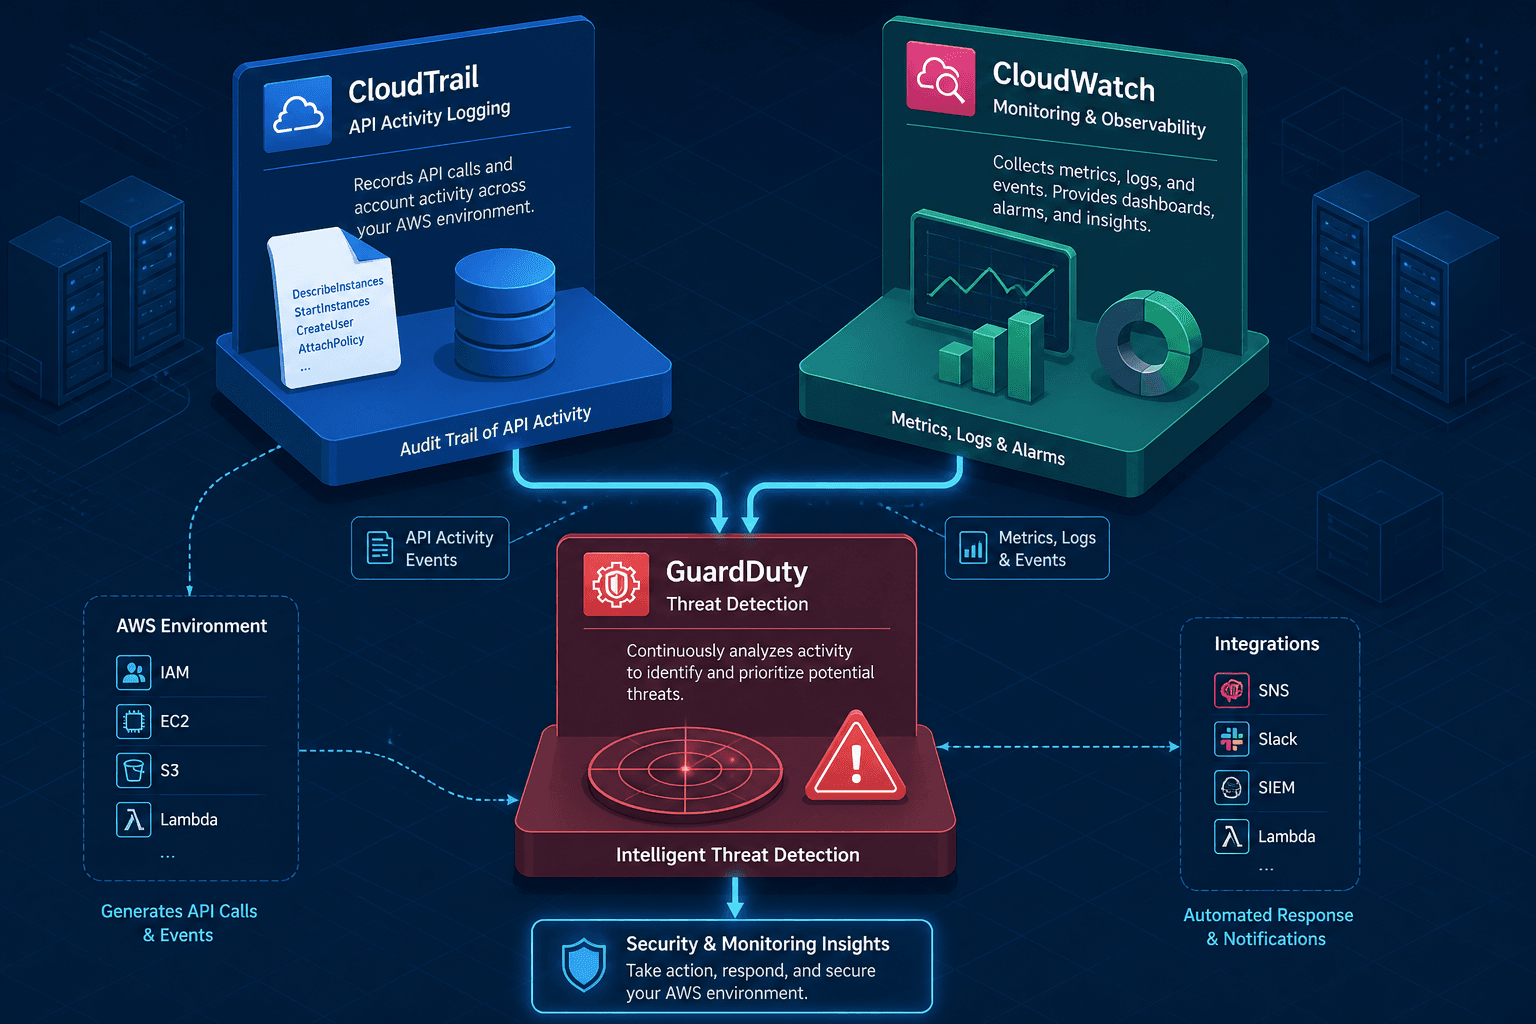
In AWS security and observability architecture, confusion often arises because CloudTrail, CloudWatch, and GuardDuty all deal with logs, events, and security. However, conflating them leads to blind spots. CloudTrail is an administrative audit log. CloudWatch is an operational monitoring and telemetry service. GuardDuty is a threat detection service. Understanding their distinct mechanisms is critical for building a defense-in-depth strategy.
CloudTrail: The Administrative Ledger
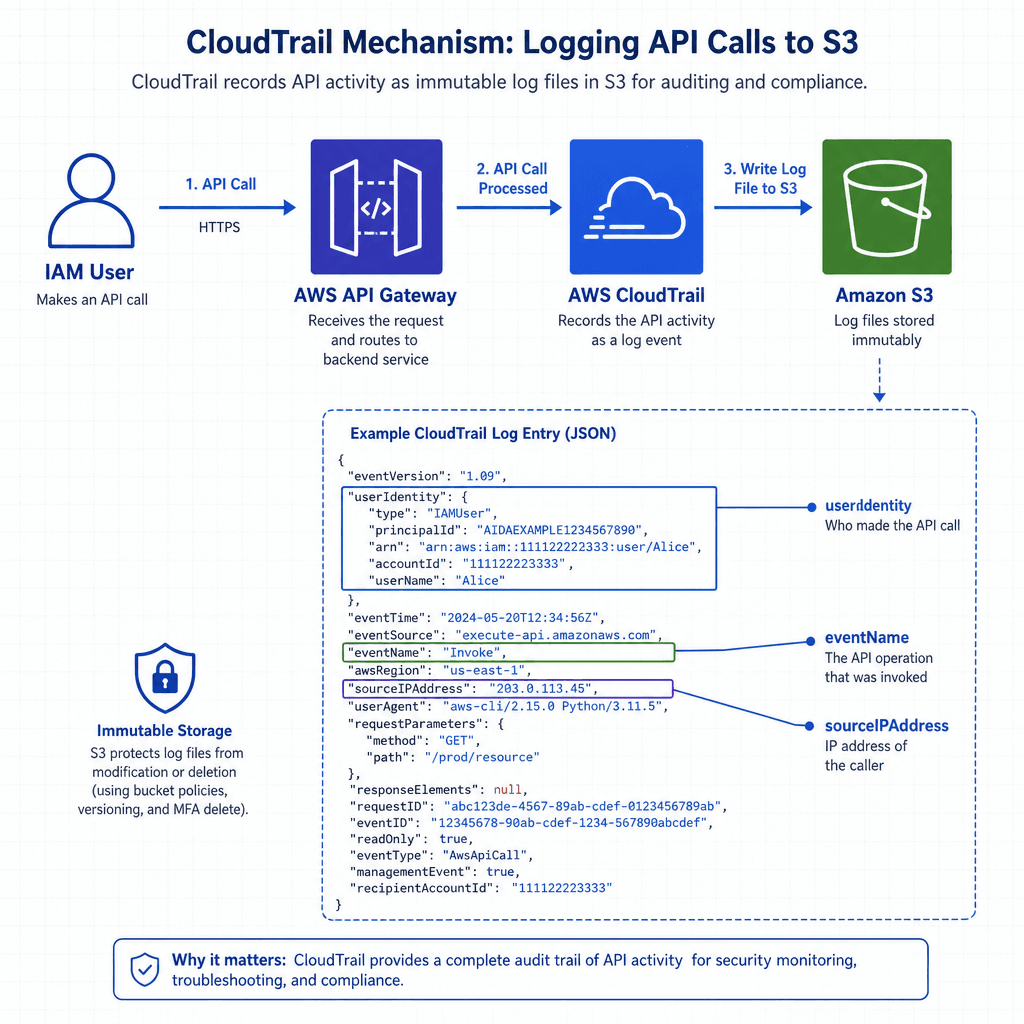
CloudTrail’s primary function is to record every API call made in your AWS account. It acts as an immutable ledger of identity and action. When a user, role, or service interacts with AWS, CloudTrail captures the event and delivers it to an S3 bucket.
CloudTrail is the primary source for aws security logs, recording every API call across your environment. The mechanism is straightforward: every request to an AWS service API is logged. The log entry includes:
eventTime: When the request was made.userIdentity: Who made the request (IAM user, assumed role, or service principal).eventName: What action was taken (e.g.,RunInstances,CreateBucket).requestParameters: The parameters passed to the API.sourceIPAddress: The IP address from which the request originated.
This data is designed for forensic analysis and compliance auditing. It answers the question: "Who did what, when, and from where?" CloudTrail does not analyze the content of the data being transferred, nor does it monitor system performance. It simply records the control plane events.
For example, if an attacker uses compromised credentials to launch an EC2 instance, CloudTrail logs the RunInstances API call. This log entry provides the evidence needed for investigation but does not inherently alert you to the threat. It is a passive recorder. While CloudTrail logs events, it does not perform aws detection; that is GuardDuty's role.
CloudWatch: The Operational Pulse
CloudWatch is the core of aws monitoring, focused on operational health and performance. It collects and tracks metrics, logs, and events from AWS resources and custom applications.
CloudWatch operates on three main pillars:
- Metrics: Numeric data points describing resource performance over time. Examples include CPU utilization, network in/out, and disk read/write operations. Metrics are time-series data used to visualize system health.
- Logs: Application and system logs. CloudWatch Logs can ingest log files from EC2 instances, Lambda functions, and other services. You can use CloudWatch Logs Insights to query these logs using a purpose-built query language.
- Events: Changes in the state of your AWS resources. CloudWatch Events (now largely integrated with Amazon EventBridge) notify you when specific state changes occur, such as an EC2 instance changing from
runningtostopped.
CloudWatch is designed for operational visibility. It answers the question: "How is my system performing?" It enables you to set alarms based on metric thresholds (e.g., "Alert if CPU > 80% for 5 minutes") and trigger automated actions via AWS Lambda or Auto Scaling.
Unlike CloudTrail, which focuses on identity and API calls, CloudWatch focuses on resource behavior and application output. It is the tool you use to ensure your applications are running smoothly and to detect operational anomalies like high latency or resource exhaustion.
GuardDuty: The Threat Intelligence Engine
GuardDuty provides aws detection capabilities by analyzing data sources for anomalies designed to discover and protect your AWS accounts from threats. It uses machine learning, statistical analysis, and integrated threat intelligence feeds to identify potential security issues.
GuardDuty analyzes three primary data sources:
- VPC Flow Logs: Network traffic flow logs from VPCs, NAT gateways, and Elastic Load Balancers.
- DNS Logs: DNS query logs from VPCs.
- CloudTrail Logs: Management events from CloudTrail.
GuardDuty does not just log events; it analyzes them for anomalies. For example, it might detect:
- Unauthorized API calls: API calls from unexpected IP addresses or regions.
- Cryptocurrency mining: Instances making outbound connections to known cryptocurrency mining pools.
- Reconnaissance: Port scanning or enumeration attempts.
- Compromised instances: Instances communicating with known malicious IPs or domains.
GuardDuty generates findings with severity levels (Low, Medium, High) and detailed descriptions. These findings are delivered to CloudWatch Events, allowing you to trigger automated remediation workflows.
GuardDuty is designed for threat detection. It answers the question: "Is someone attacking my environment?" It leverages AWS’s vast threat intelligence data to identify known malicious actors and behaviors, providing a layer of security that goes beyond simple logging.
The Integrated Workflow: A Concrete Scenario
To understand how these services work together, consider a scenario where an attacker compromises an IAM user’s credentials and attempts to launch a crypto-mining instance.
-
CloudTrail: The attacker calls the
RunInstancesAPI. CloudTrail logs this event, recording the IAM user ID, the timestamp, and the source IP address. This log is stored in S3 for later forensic analysis. If the attacker’s IP is from an unexpected location, this log provides the evidence needed to trace the breach. -
GuardDuty: GuardDuty ingests the CloudTrail log. It analyzes the
RunInstancescall and detects that the IAM user is making an API call from an IP address associated with known malicious activity. GuardDuty generates a high-severity finding: "UnauthorizedAccess:IAMUser/MaliciousIPCaller" or "CryptoCurrency:EC2/BitcoinTool.B." This finding is sent to CloudWatch Events. -
CloudWatch: CloudWatch Events receives the GuardDuty finding. An event rule triggers an AWS Lambda function that automatically terminates the compromised EC2 instance. Additionally, CloudWatch Metrics might show a sudden spike in CPU utilization on the new instance, confirming the mining activity. CloudWatch Logs might capture application logs from the instance, providing further context.
This integrated workflow demonstrates a secure aws architecture where services complement each other.
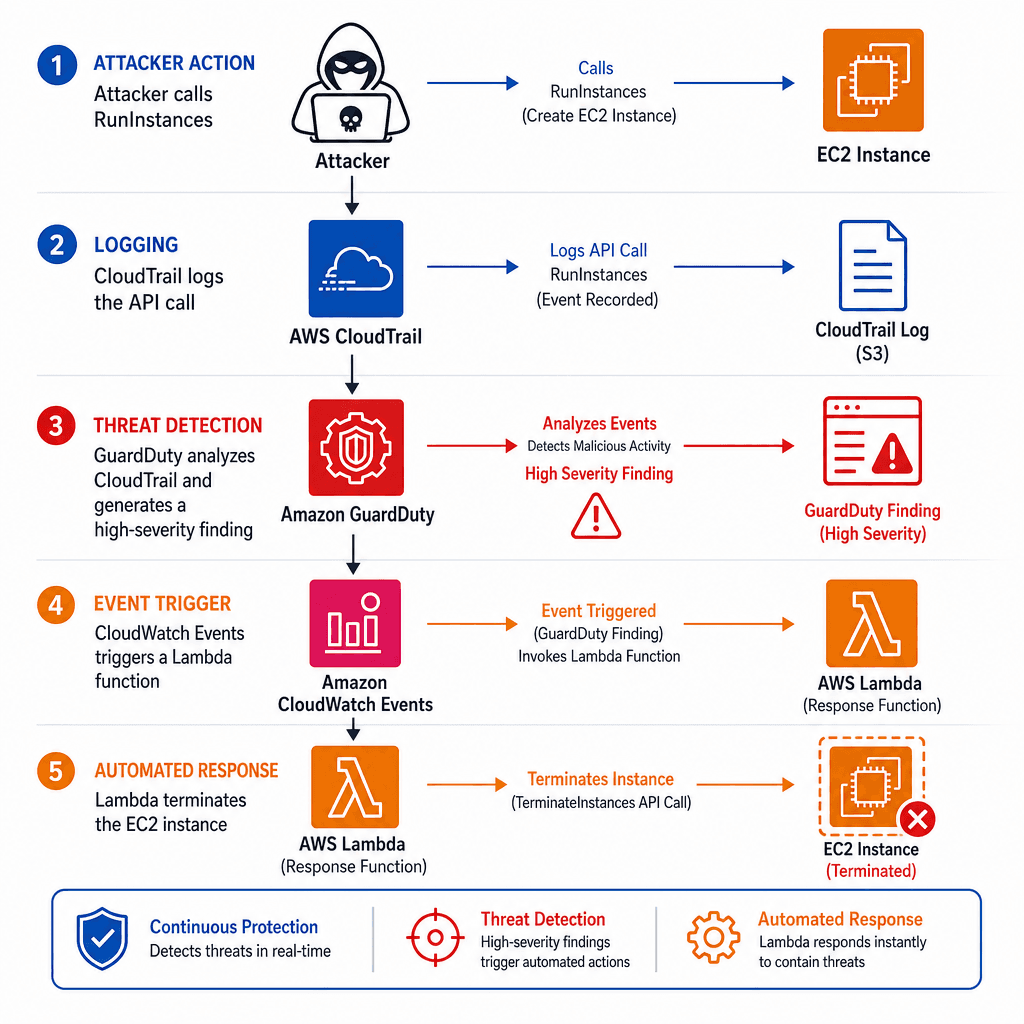
In this scenario, CloudTrail provides the audit trail, GuardDuty detects the threat, and CloudWatch enables automated response. Each service plays a distinct role, and together they provide granular visibility and security.
Conclusion
CloudTrail, CloudWatch, and GuardDuty are complementary services that form the backbone of AWS security and observability. CloudTrail records who did what, CloudWatch monitors how the system is performing, and GuardDuty detects what is malicious. Understanding the differences in cloudtrail vs cloudwatch vs guardduty is essential for effective AWS security. By understanding their distinct mechanisms and integrating them into a cohesive workflow, cloud engineers can build resilient, secure, and observable AWS environments.
Related posts
The Mechanics of AWS Security Visibility: CloudTrail, CloudWatch & GuardDuty
A detailed examination of AWS CloudTrail, CloudWatch, and GuardDuty for effective security monitoring and incident response.
Least Privilege in Practice
A practical guide to implementing least privilege in AWS using IAM Access Analyzer, policy generation, and condition keys for secure access management.
Building a Centralized Audit Log for Identity Events with ELK Stack
A walkthrough for building a centralized audit log for identity events using the ELK stack to ensure audit compliance and effective log management.