Cost per Million Tokens: Building an Honest Model
A practical framework for calculating true cost per million tokens, including GPU utilization, TCO, and self-hosting expenses for engineering teams.
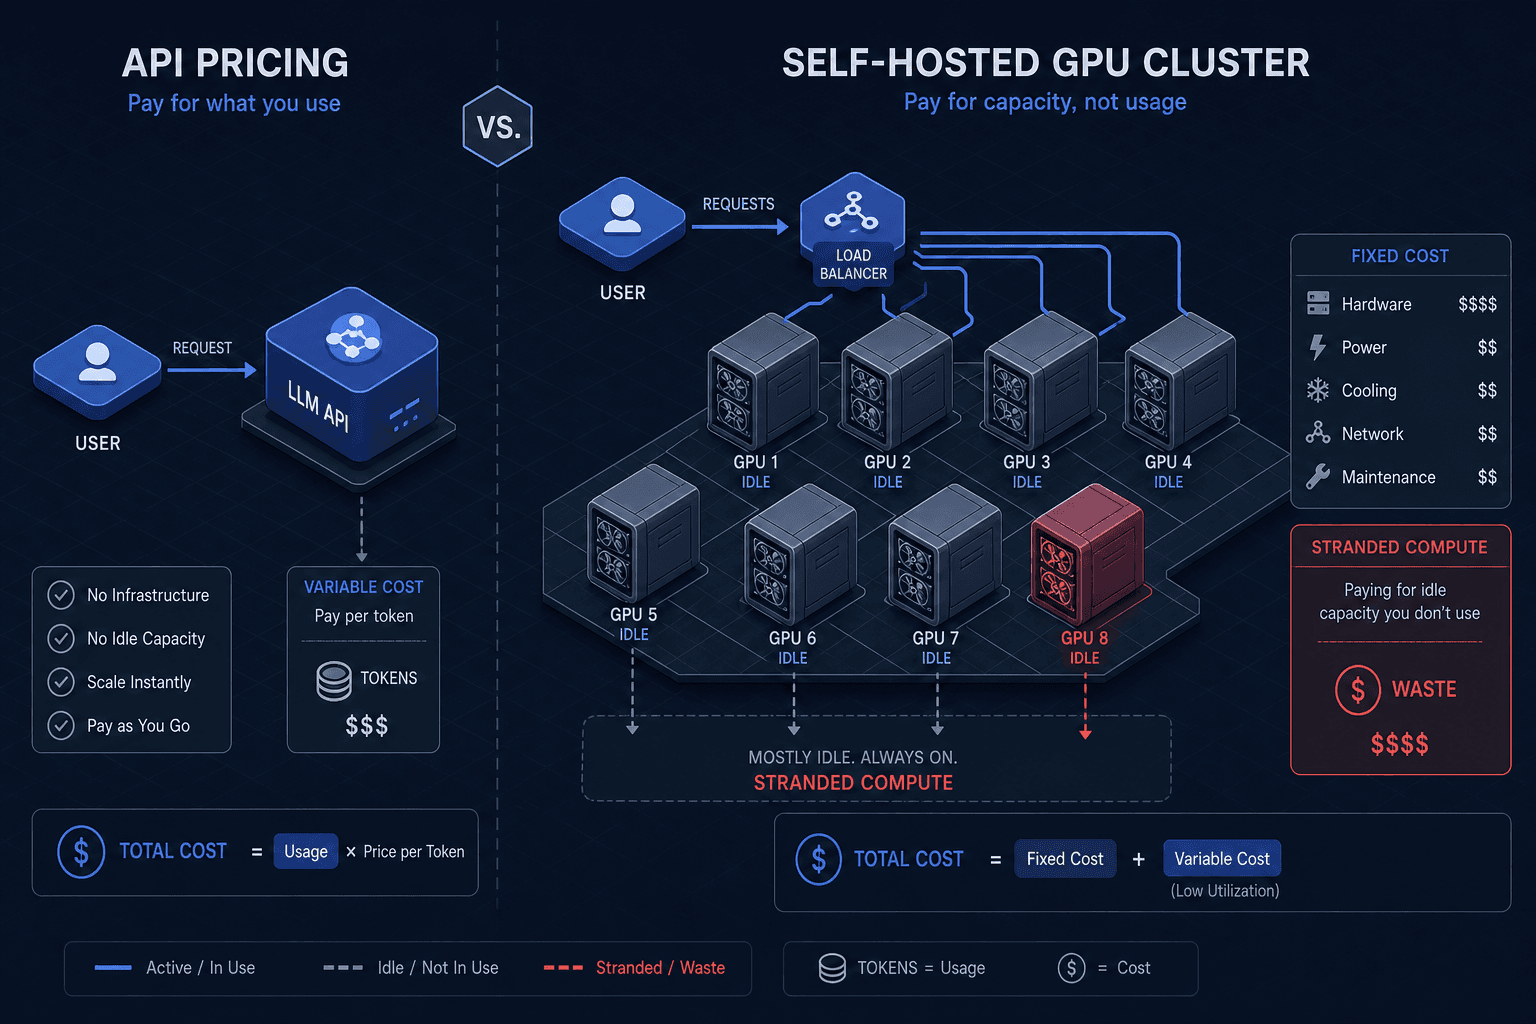
If you are an engineering manager or platform engineer, you have likely seen the spreadsheet. It compares the $0.01 per million tokens of an API call against the $0.005 per million tokens of self-hosting a quantized model on an A10G. The math looks simple. The decision seems obvious. But this calculation is fundamentally broken because it treats GPU compute as a variable cost that scales linearly with usage. In reality, GPU infrastructure is a fixed cost asset that decays in value when idle. For engineering leaders, the standard spreadsheet is misleading because it ignores the temporal nature of compute, the overhead of maintaining infrastructure, and the reality that hardware must be paid for regardless of whether it is actively processing tokens. This hidden overhead is what separates theoretical efficiency from actual financial impact.
This is Part 3 of the GPU Economics for AI Teams series.
The "cost per million tokens" metric is not a price; it is a function of utilization. To build an honest model, we must shift from looking at token rates to looking at effective throughput and idle capacity.
The Illusion of List Price
When you pay OpenAI or Anthropic, you are paying for their aggregate utilization. Their infrastructure is optimized for massive concurrency, where thousands of requests fill every tensor core. The "list price" assumes 95%+ GPU utilization.
When you self-host, you own the hardware. You cannot sell unused compute to other tenants. If your application has low traffic, your GPUs sit idle, yet you pay the full hourly rate for the instance. This is the idle capacity problem.
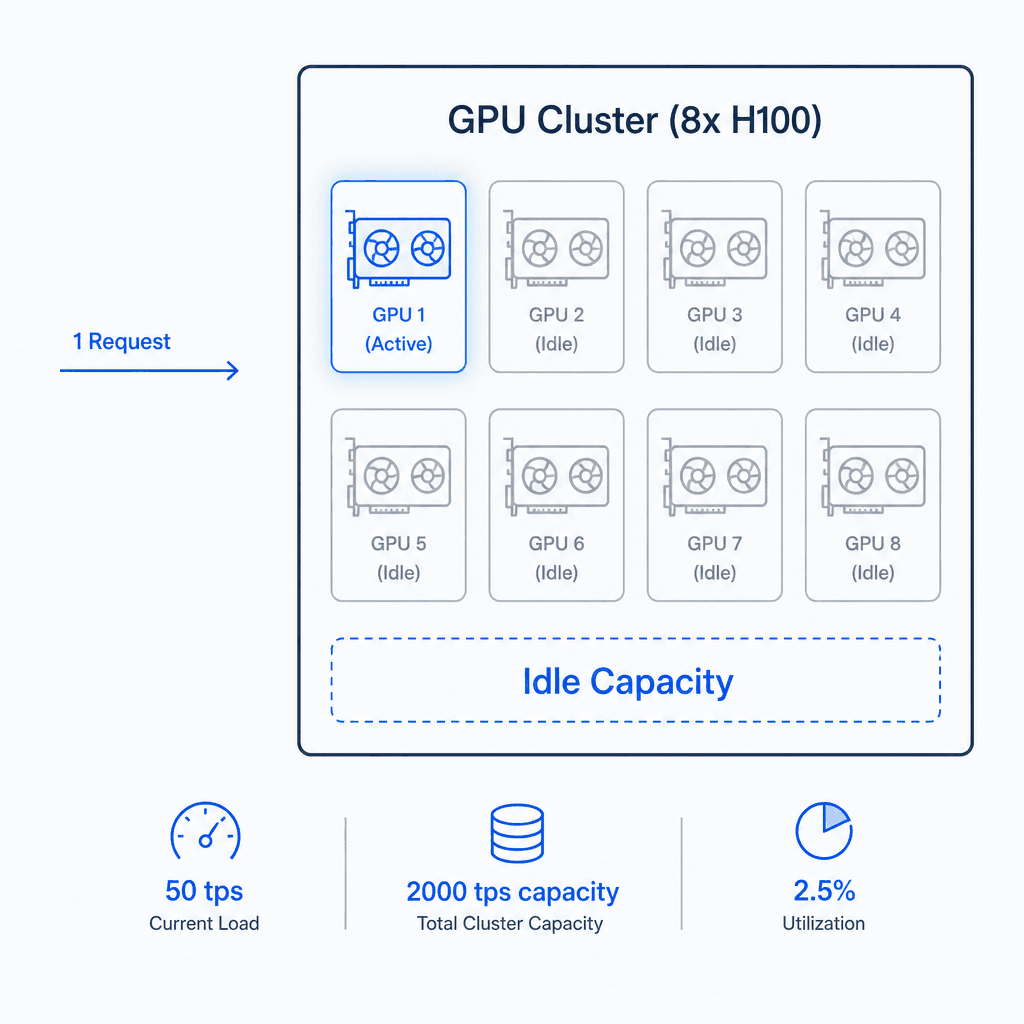
Consider a scenario where you serve a Llama 3 70B model using 8x H100 GPUs via vLLM. The theoretical throughput might be 2,000 tokens per second (tps). However, if your actual load is only 50 tps, you are using 2.5% of the available compute capacity. You are still paying for the 8x H100 cluster. The cost per token does not drop because you are using less; it skyrockets because you are paying for the whole machine for a fraction of its work.
The Utilization Multiplier
To calculate true cost, we must introduce the Utilization Multiplier. This is the ratio of theoretical peak throughput to actual sustained throughput. This metric captures the gap between what you pay for and what you actually use.
Let’s look at a concrete mechanism. Imagine you are running a RAG (Retrieval-Augmented Generation) pipeline.
Actor A: The Bursty User User Alice queries the system once every 10 minutes. The query takes 2 seconds to process.
- GPU Allocation: You must keep the model weights in VRAM. For Llama 3 70B (INT4), this requires ~35-40GB VRAM per GPU. You need at least one H100 just to hold the model, plus overhead for KV cache.
- Idle Time: For 598 seconds, the GPU is doing nothing but maintaining state.
- Cost: If an H100 spot instance costs $3.00/hour, and you process 100 tokens every 10 minutes (600 tokens/hour), your cost is: This seems cheap. But now consider the fixed overhead.
Actor B: The Batch Processor A nightly job processes 1 million documents. It runs for 4 hours, fully saturating the GPU.
- Throughput: 2,000 tps sustained.
- Total Tokens: 2,000 * 3,600 * 4 = 28.8 million tokens.
- Cost: $3.00/hour * 4 hours = $12.00.
- Cost Per Token: per token.
The difference is not in the model or the GPU. It is in the utilization efficiency. Actor A’s cost is 12,000x higher than Actor B’s. An honest model must account for this variance. If your traffic is unpredictable, your "cost per token" is a distribution, not a mean.
The Hidden TCO Layers
Beyond GPU hours, three hidden mechanisms drive up the self hosting cost for self-hosted models:
- KV Cache Eviction: The Key-Value cache grows with context length. If you do not implement efficient eviction (e.g., PagedAttention in vLLM), you hit OOM (Out of Memory) errors faster. This forces you to either reduce the number of concurrent users or increase the number of GPUs to distribute the KV cache load (if sharding is used). Both options increase the base cost without increasing throughput.
- Quantization Overhead: Running FP16/BF16 models is fast but memory-heavy. Quantizing to INT8 or INT4 reduces VRAM usage by ~50-75%, allowing you to fit larger models or serve more concurrency on the same hardware. However, quantization introduces latency overhead. The engineering tradeoff is between memory cost (more GPUs) and compute cost (slower inference requiring longer GPU hold times).
- Power and Cooling (PUE): Cloud providers like AWS or Lambda Labs include power in the hourly rate. If you rent bare metal or colocation, you must calculate Power Usage Effectiveness. A PUE of 1.5 means about 33% of your power bill is cooling and infrastructure, not compute. This adds ~30-50% to the raw electricity cost of the GPUs. As noted by industry standards such as those from the U.S. Department of Energy, data center PUE typically ranges from 1.2 to 1.5+, significantly impacting the true energy cost of high-density GPU clusters.
The Breakeven Calculation
Let’s build a practical framework for deciding when to self-host. Assume you are evaluating Llama 3 70B.
Assumptions:
- API Cost: $0.01 per 1M input tokens, $0.015 per 1M output tokens.
- Self-Hosted Hardware: 4x A100 80GB GPUs (or equivalent H100 capacity).
- Hardware Cost: $1.50/hour per GPU (cloud spot/on-demand mix). Total: $6.00/hour.
- Engineering Support: On-demand engineering support at $20/hour.
- Total Fixed Hourly Cost: $26.00/hour.
Scenario: 10 Million Tokens/Month
- API Cost: $100,000 * $0.01 = $1,000/month.
- Self-Hosted Cost:
- If you run 24/7: $26.00 * 24 * 30 = $18,720/month.
- Result: API is 18x cheaper.
Scenario: 100 Million Tokens/Month with High Utilization
- API Cost: $10,000/month.
- Self-Hosted Cost:
- If you can sustain 1,000 tps average, you process 3.6 million tokens/hour.
- Wait, that’s too high. Let’s assume a realistic sustained load of 100 tps (due to batching and queueing).
- Tokens/hour: 100 * 3,600 = 360,000.
- Hours needed to process 100M tokens: 100,000,000 / 360,000 ≈ 277 hours.
- Compute Cost: 277 hours * $6.00 = $1,662.
- Engineering Cost: 277 hours * $20.00 = $5,540.
- Total Self-Hosted: $7,202.
- Result: Self-hosting is 28% cheaper than API.
But this only works if you can maintain 100 tps average. If your traffic is bursty and you only use the GPUs for 50 hours/month, the cost jumps to:
- Compute: 50 * $6 = $300.
- Engineering: 50 * $20 = $1,000.
- Total: $1,300.
- Effective Cost Per Token: $1,300 / 100,000,000 = $0.000013.
- API Equivalent: $0.000010.
At low utilization, the engineering overhead makes self-hosting more expensive than the API, even if the raw compute is cheaper.
Conclusion
The "cost per million tokens" is a vanity metric unless paired with utilization data. For engineering teams, the decision to self-host is not just about GPU prices; it is about absorbing fixed costs through scale and efficiency.
- Calculate your effective throughput, not peak throughput.
- Include engineering labor as a direct cost of compute.
- Monitor utilization: If your GPUs are idle >50% of the time, you are over-provisioned. Scale down or switch to API.
Build your financial model around these mechanisms, not just list prices.
CTA: Audit Your GPU Utilization
Before committing to a self-hosting strategy, audit your current infrastructure. Use tools like nvtop or cloud provider metrics to track actual GPU utilization over a two-week period. If your average utilization is below 30%, self-hosting is likely more expensive than the API due to idle capacity costs. Calculate your breakeven point using the framework above, ensuring you account for both hardware and engineering support costs.
Related posts
Jailbreak Detection: Classifiers, Heuristics, and Cost
Examines jailbreak detection methods using classifiers and heuristics, focusing on precision, recall, latency, and cost trade-offs for security and ML engineers.
Estimating LLM Costs Before You Build
A practical guide for engineering managers and architects on estimating LLM costs using unit economics, token forecasting, and sensitivity analysis to build within budget.
Multi-Provider Failover with LiteLLM
Implement resilient AI routing using LiteLLM to handle multi-provider failover and fallback strategies for backend systems.
