
Synthetic Identity Fraud Detection: Graph Analysis and Velocity Checks
Explore methods for detecting synthetic identity fraud using graph detection and velocity checks to secure onboarding processes.
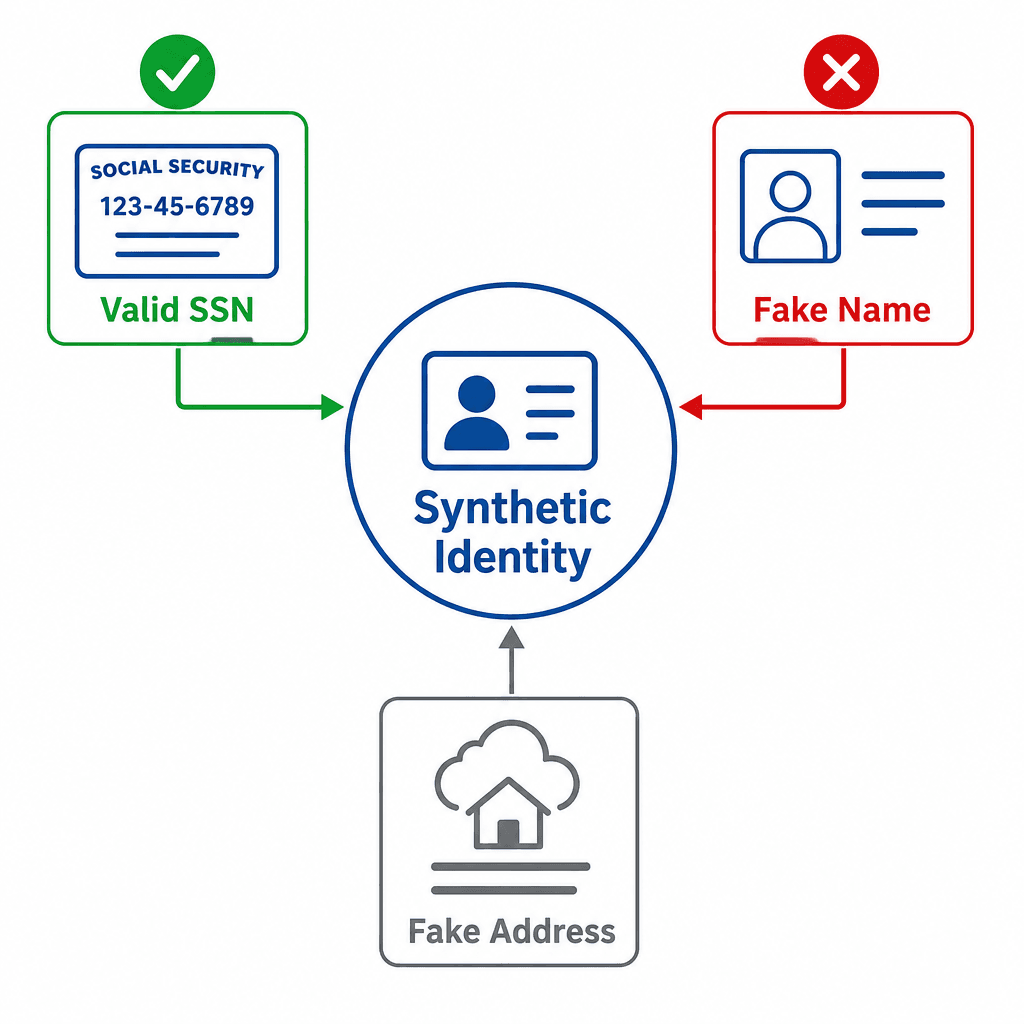
Synthetic identity fraud (SIF) represents a unique threat vector because the target entity does not exist until the attacker constructs it. Unlike Account Takeover (ATO), where an attacker steals credentials for a real person, SIF involves stitching together valid and fabricated Personally Identifiable Information (PII) to create a new legal persona. This creates a "Frankenstein" identity that passes traditional Know Your Customer (KYC) checks because it contains valid government identifiers, yet has no historical credit footprint.
To detect this, engineers must move beyond static attribute validation. Effective defense requires analyzing the relationships between onboarding artifacts via graph detection and monitoring temporal behavior through velocity checks.
The Mechanism of Synthesis
SIF exploits the gap between valid government identifiers and the absence of financial history. Attackers typically use a valid Social Security Number (SSN) belonging to a child, an elderly person with poor credit history, or an individual who has never applied for credit. They pair this SSN with a fake name and address.
Because the SSN is valid in government databases, initial identity verification passes. However, the identity has no prior credit history, meaning it cannot be flagged by traditional credit bureau models that rely on historical repayment behavior. The detection challenge is that these identities look legitimate in isolation but exhibit suspicious patterns when viewed as part of a larger network.
Graph Detection: Mapping Artifact Relationships
The primary mechanism for detecting SIF is graph analysis. In this context, a graph is a data structure where nodes represent entities (e.g., an IP address, an email address, an SSN, a device ID) and edges represent relationships between them. Attackers often reuse infrastructure across multiple synthetic applications to save time and cost.
Consider a scenario where an attacker, "Actor A," attempts to open five credit cards using five different fake names and five different phone numbers. However, Actor A uses the same mobile device fingerprint and the same home IP address for all five applications.
In a relational database, these five applications might look like isolated events. In a graph database, they form a connected component. The mechanism here is resource sharing. We define specific nodes as "high-value" or "shared" resources:
IP_AddressDevice_IDEmail_DomainPhone_NumberBank_Account
When an onboarding request arrives, we query the graph for existing edges connected to these nodes. If a single IP_Address node is connected to more than unique SSN nodes within a short timeframe, the graph reveals a "star" topology. This is a strong signal of fraud because legitimate users rarely share devices or IPs with dozens of unrelated strangers.
The detection logic operates on the principle of degree centrality. We calculate the degree (number of connections) for each resource node. If the degree exceeds a threshold, the node is marked as "tainted." Any new identity application touching a tainted node inherits a high fraud risk score. This approach catches organized crime rings who use botnets or shared proxy services to mass-produce identities.
Velocity Checks: Detecting Temporal Anomalies
Graph detection identifies who is connected to what. Velocity checks identify how fast things are happening. Velocity is not merely a count of requests per second; it is a measure of the event frequency delta relative to the expected lifetime of an identity.
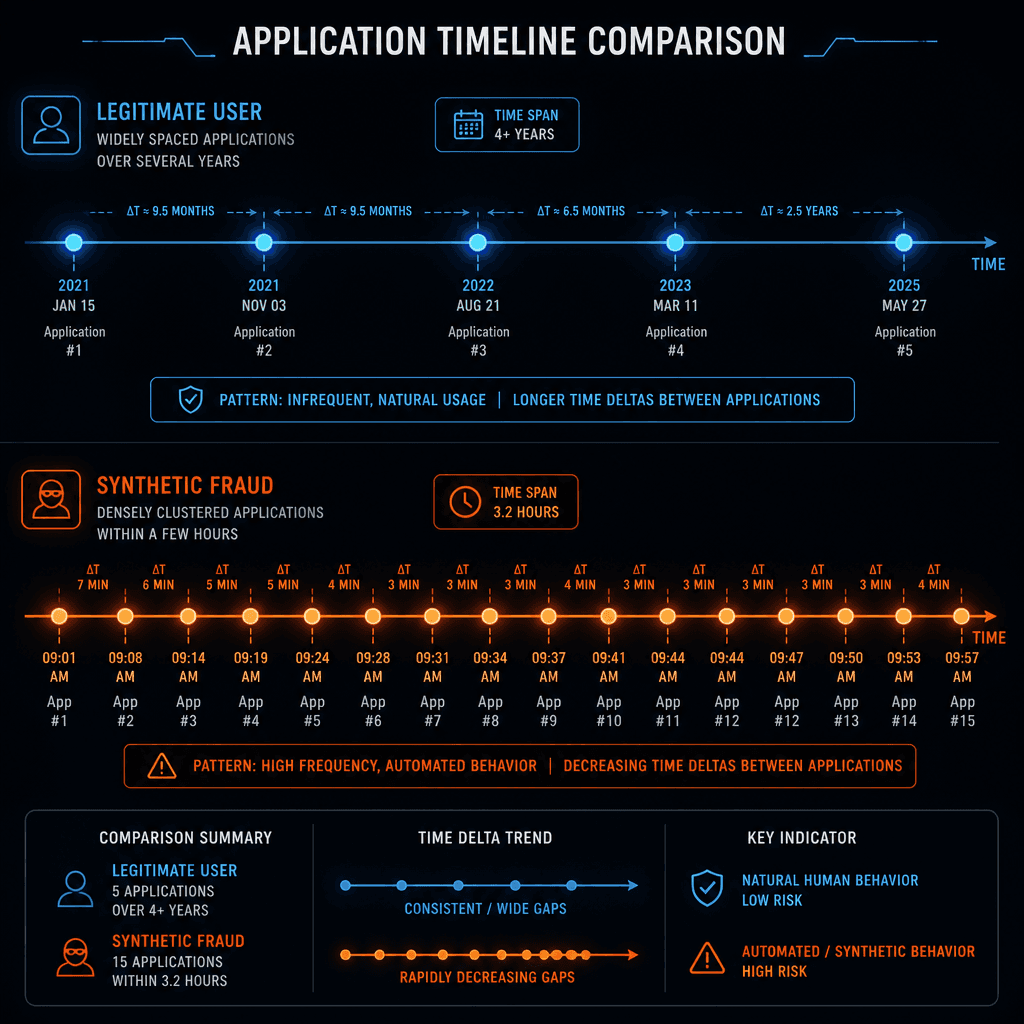
Traditional velocity rules often fail because they apply raw thresholds (e.g., "no more than 3 applications per hour"). Sophisticated attackers slow down their pace to avoid triggering these hard limits. Instead, effective velocity checks monitor the acceleration of specific events.
Consider the feature days_since_last_application. For a legitimate user, this value is typically large (years or decades). For a synthetic identity builder, this value shrinks rapidly as they test new combinations. The mechanism here is derivative anomaly detection. We do not just check the current timestamp; we check the delta between the current event and the previous event for the same resource node.
For example, if an Email_Address was used to apply for a loan 30 days ago, and is used again today, the delta is 30 days. If the same email is used 10 times in the last 24 hours, the average delta is 2.4 hours. This high frequency indicates automated behavior.
Furthermore, velocity checks must account for cross-channel correlation. An attacker might space out applications to avoid single-channel velocity triggers. However, if the same Device_ID applies for a credit card on Monday, opens a checking account on Wednesday, and applies for a payday loan on Friday, the cross-channel velocity is high. The graph connects these disparate services through the shared artifact, revealing a pattern that single-channel rules miss.
Integrating Graph and Velocity Signals
Neither graph nor velocity checks are sufficient alone. Graphs can generate false positives if a family member shares a home IP. Velocity checks can be gamed if an attacker uses a distributed network of unique devices. The robust detection mechanism combines both to mitigate synthetic identity fraud effectively.
We assign a composite risk score based on two dimensions:
- Graph Strength: The number of unique identities linked to a shared resource.
- Velocity Intensity: The frequency of applications over a rolling window.
If a node has high graph strength (many connections) but low velocity (applications spaced out over months), it may be a legitimate referral program or a family sharing a home. If it has high graph strength and high velocity, it is almost certainly synthetic fraud.
Implementing this requires a real-time feature store that updates graph degrees and velocity counters immediately after each onboarding attempt. The system must query the graph for historical connections and calculate the time deltas before making the final approval decision. This shifts the defense from reactive blacklisting to proactive pattern recognition.
Conclusion
Synthetic identity fraud exploits the gap between valid government identifiers and the absence of financial history. Detection requires treating onboarding artifacts as a network rather than isolated data points. By leveraging graph detection to uncover shared resources and velocity checks to detect temporal anomalies, fraud engineers can identify the structural patterns of onboarding fraud. This approach moves beyond simple rule-based filtering, providing a mechanism to detect fraud at the source of the attack infrastructure.
Related posts
Statistical Significance in LLM Evals
Learn how to apply statistical significance, confidence intervals, and bootstrap methods to validate LLM evaluation results with proper sample sizes.
Risk-Based Authentication With ML Scoring
Explore how machine learning enhances risk-based authentication by generating dynamic risk scores for adaptive identity verification.
Risk-Based vs Adaptive Auth: Policy Design
An examination of risk-based and adaptive authentication mechanisms, focusing on policy design and step-up verification for identity engineers.
