Tracing LLM Calls with OpenTelemetry
Learn how to implement OpenTelemetry for tracing LLM calls, improving observability and debugging in GenAI applications.
This is Part 3 of the LLMOps in Production series.
When you integrate a Large Language Model (LLM) into a backend service, you are no longer just calling a database or an API; you are invoking a probabilistic black box. Standard HTTP logging tells you that a request happened, but it fails to explain why the model hallucinated, how long the context window was processed, or where the latency spiked in the chain of tool calls. To debug this, you need distributed tracing. Specifically, you need OpenTelemetry configured with the new Semantic Conventions for Generative AI (GenAI).
This guide explains the mechanism of integrating OTel with LLM providers, focusing on how to structure spans so that observability tools (like Datadog, New Relic, or Jaeger) can correlate LLM behavior with application performance.
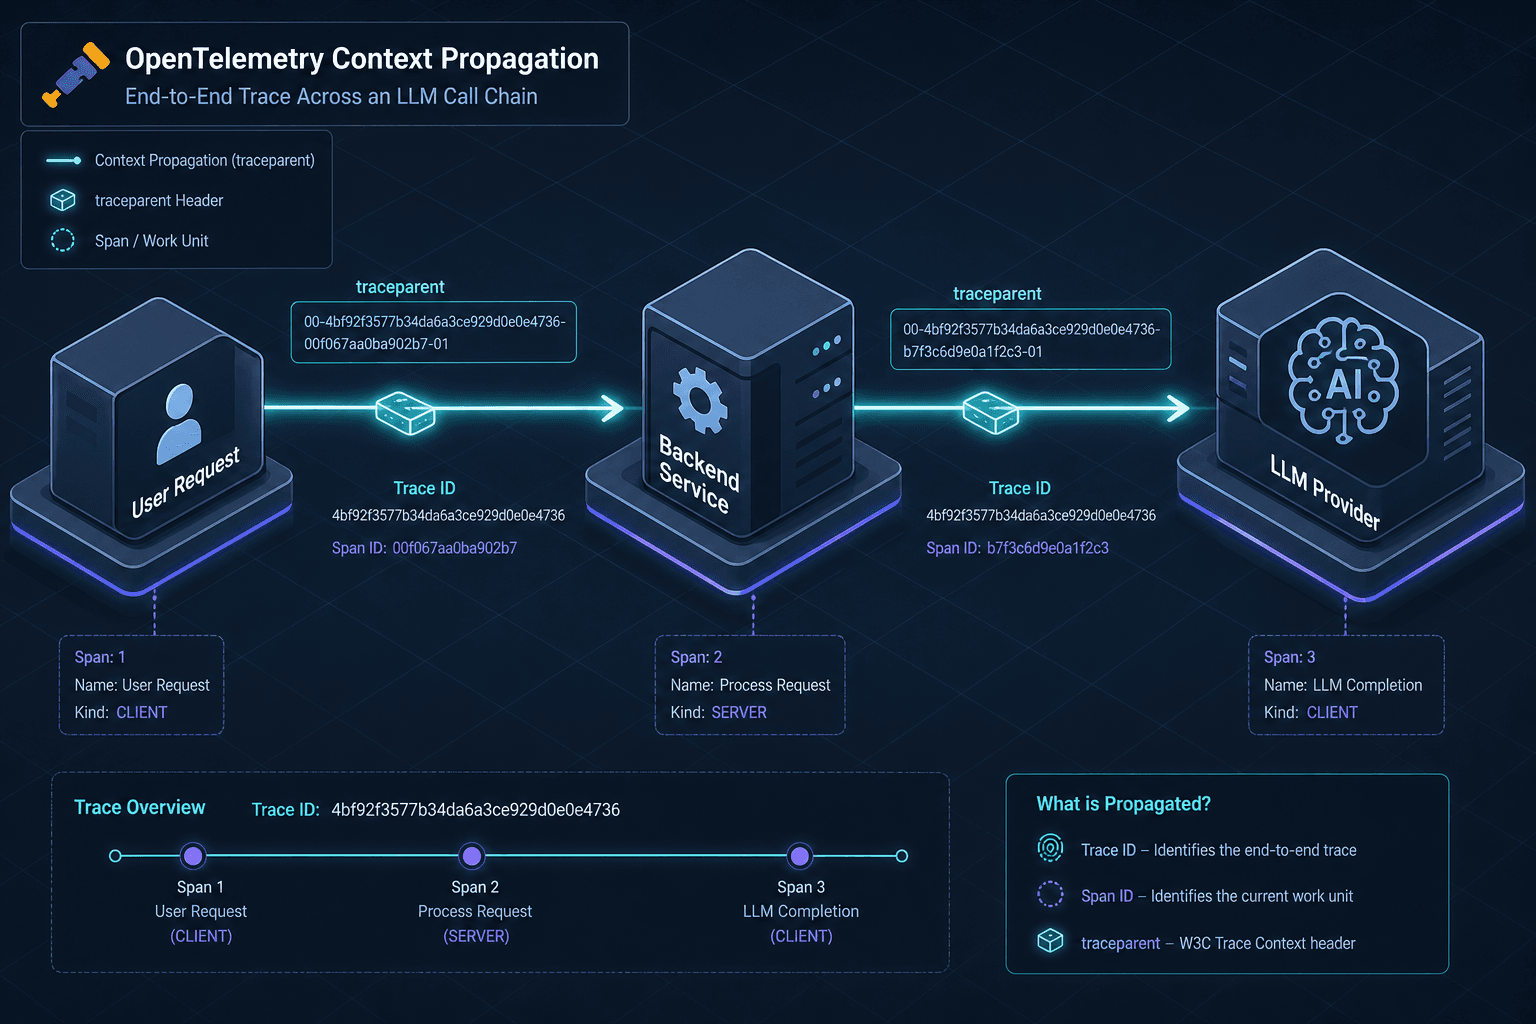
The Mechanism of Context Propagation
The foundation of tracing is the Trace ID. When a user triggers an action in your application, a unique Trace ID is generated. This ID must propagate through every service boundary, including the call to the LLM provider (e.g., OpenAI, Anthropic, Hugging Face).
In traditional microservices, this is handled by HTTP headers (traceparent). However, LLM APIs often use different transport mechanisms (REST, gRPC, or WebSocket streams). The mechanism here is automatic context injection. If you use an OTel SDK compatible with your language (Python, Java, Go), the SDK intercepts the outgoing request and injects the current trace context into the headers.
For example, when using the OpenAI Python client with OTel instrumentation, the library automatically attaches the traceparent header to the HTTP POST request sent to api.openai.com. This ensures that the span created inside your application and the span created by the LLM provider (if they support it) or the span representing the HTTP call are linked under the same Trace ID.
# Conceptual example of how context propagates
import openai
from opentelemetry import trace

tracer = trace.get_tracer(__name__)
client = openai.OpenAI()

with tracer.start_as_current_span("user_request_handler") as span:
    # The OTel SDK automatically injects trace context into the OpenAI client
    response = client.chat.completions.create(
        model="gpt-4",
        messages=[{"role": "user", "content": "Debug this trace"}]
    )

    # The 'span' now contains the result of the LLM call
    span.set_attribute("llm.output", response.choices[0].message.content)
Without this propagation, you end up with orphaned spans. You see a slow HTTP request in your trace, but you cannot drill down to see the specific token generation time or the model version used, because the context was lost at the API boundary.
Semantic Conventions for LLMs
Prior to late 2023, there was no standard way to label LLM spans. Developers used arbitrary attributes like model.name or provider. This made cross-provider analysis impossible. The OpenTelemetry project introduced Semantic Conventions for Generative AI (gen_ai.*) to solve this.
These conventions define a strict schema for LLM spans. When you instrument your code, you must ensure your telemetry data adheres to these keys. The key attributes are:
gen_ai.system: Identifies the provider (e.g.,openai,anthropic,hugging_face). This allows you to filter traces by vendor.gen_ai.request.model: The specific model version (e.g.,gpt-4-turbo,claude-3-opus). This is critical for A/B testing models and comparing latency/cost between versions.gen_ai.response.id: The unique ID returned by the LLM provider for that specific completion. This enables you to correlate logs, costs, and outputs across different systems.
By using these standardized keys, your observability platform can automatically group traces by model version. If you switch from gpt-3.5 to gpt-4, you can immediately see if the latency distribution changed, without manually parsing JSON logs.
# Correctly labeling an LLM span according to OTel SemConv
span.set_attribute("gen_ai.system", "openai")
span.set_attribute("gen_ai.request.model", "gpt-4")
span.set_attribute("gen_ai.request.temperature", 0.7)
span.set_attribute("gen_ai.response.id", response.id)
Ingestion and Cost Tracking
One of the most powerful mechanisms of OTel for LLMs is cost attribution. LLM costs are driven by input tokens (prompt) and output tokens (completion). By capturing these counts directly in the span attributes, you can calculate the cost of any trace in real-time.
Most LLM providers return token counts in their response metadata. You should extract these and attach them to the span.
# Capturing token usage for cost analysis
span.set_attribute("gen_ai.request.max_tokens", 1000)
span.set_attribute("gen_ai.usage.input_tokens", response.usage.prompt_tokens)
span.set_attribute("gen_ai.usage.output_tokens", response.usage.completion_tokens)
With these attributes present, you can run SQL-like queries in your observability dashboard:
"Show me the average cost per trace for
gen_ai.request.model= 'gpt-4' wherehttp.response.status_code= 200."
This transforms your trace data from a debugging tool into a financial control panel. You can identify which features in your application are driving up LLM costs and optimize them accordingly.
Debugging Non-Deterministic Behavior
LLMs are non-deterministic. Two identical prompts can yield different outputs. This makes debugging difficult. OTel helps by preserving the full context of the call.
In your span, you should include the input messages and the output completion. This creates a complete snapshot of the interaction. If a user reports an issue, you can replay the exact prompt and context that led to the bad output.
However, be cautious with data privacy. Never log PII (Personally Identifiable Information) in span attributes. Use attribute filtering in your OTel collector to scrub sensitive data before it reaches your backend.
# Example of scrubbing sensitive data
# In your OTel Collector configuration (otelcol-config.yaml):
processors:
  attributes:
    actions:
      - key: "http.request.body"
        action: delete
      - key: "gen_ai.request.messages"
        action: insert
        value: "[REDACTED]"
Conclusion
Implementing OpenTelemetry for LLMs is not just about adding more metrics; it’s about creating a causal link between your application logic and the probabilistic behavior of the model. By propagating trace contexts, using standardized gen_ai.* semantic conventions, and capturing token usage, you gain the ability to debug, optimize, and cost-track your GenAI applications with the same rigor you apply to your database queries.
Start by instrumenting your LLM client libraries with OTel SDKs. Ensure your observability platform supports the latest GenAI semantic conventions. The result is a system where every hallucination, latency spike, and cost overrun is traced back to its source.
Common Pitfalls
When implementing OpenTelemetry for LLMs, developers often encounter specific challenges that can undermine observability efforts.
- PII Leakage: LLM prompts often contain sensitive user data. If not properly filtered, this data ends up in trace attributes, creating security and compliance risks. Always configure your OTel collector to redact sensitive fields before export.
- High-Cardinality Attributes: Including arbitrary user IDs or session tokens as span attributes can create high-cardinality data, which may degrade performance in your observability backend. Stick to low-cardinality attributes like model names and status codes for filtering.
- Verbose Logging Costs: Storing full prompt and completion text in span attributes can rapidly inflate storage costs. Consider sampling strategies or storing full content in separate logs linked by Trace ID, rather than embedding it directly in trace spans.
Practical Takeaways
To effectively implement OpenTelemetry for LLM observability, keep these key principles in mind:
- Standardize Early: Adopt the official
gen_ai.*semantic conventions from day one to ensure compatibility across tools and future-proof your data structure. - Propagate Context Relentlessly: Ensure trace context is passed through all service boundaries, including external LLM API calls, to maintain end-to-end visibility.
- Monitor Costs via Spans: Leverage span attributes for token counts to enable real-time cost tracking and anomaly detection in your financial dashboards.
FAQ
Q: Does OpenTelemetry support all LLM providers? A: OpenTelemetry provides instrumentation for major providers like OpenAI, Anthropic, and Hugging Face via community-maintained SDKs. For custom or less common providers, you can write custom instrumentation using the OTel API.
Q: How do I handle rate limits in traced requests?
A: Include http.response.status_code in your span attributes. A 429 status code indicates a rate limit. You can then query traces for high rates of 429 responses to identify bottlenecks.
Q: Can I use OpenTelemetry with vector databases? A: Yes. While GenAI conventions focus on LLMs, you can use standard database semantic conventions to trace vector database calls (e.g., Pinecone, Milvus) within the same trace, providing full context for RAG pipelines.
Related posts
Spring Security and OpenTelemetry: Observability for Security Events
An examination of integrating OpenTelemetry with Spring Security to enable distributed tracing and security metrics for advanced observability.
Agent Observability: What to Log at Every Step
A practical guide to implementing agent observability, covering logging schemas, tracing, correlation IDs, and sampling strategies for developers and SREs.
Building an LLM Load Test That Reflects Real Traffic
A guide to building LLM load tests that reflect real traffic patterns using capacity planning, arrival rates, and saturation metrics.
