Agent Observability: What to Log at Every Step
A practical guide to implementing agent observability, covering logging schemas, tracing, correlation IDs, and sampling strategies for developers and SREs.
Traditional application observability assumes a linear request-response lifecycle: a user sends a request, the server processes it, and returns a response. Agents break this model. An agent is a stateful loop that makes decisions, calls external tools, retrieves context, and potentially fails or retries before producing a final answer. If you treat an agent like a standard REST API endpoint, you will lose visibility into the reasoning process that led to the output.
The core problem in agent observability is reconstructing causality. When an agent hallucinates or executes the wrong tool, you need to see the exact prompt context, the model’s confidence, the tool input/output, and the subsequent decision logic. This requires moving beyond simple logging to structured tracing with rigorous correlation.
The State Problem: Why Logs Are Not Enough
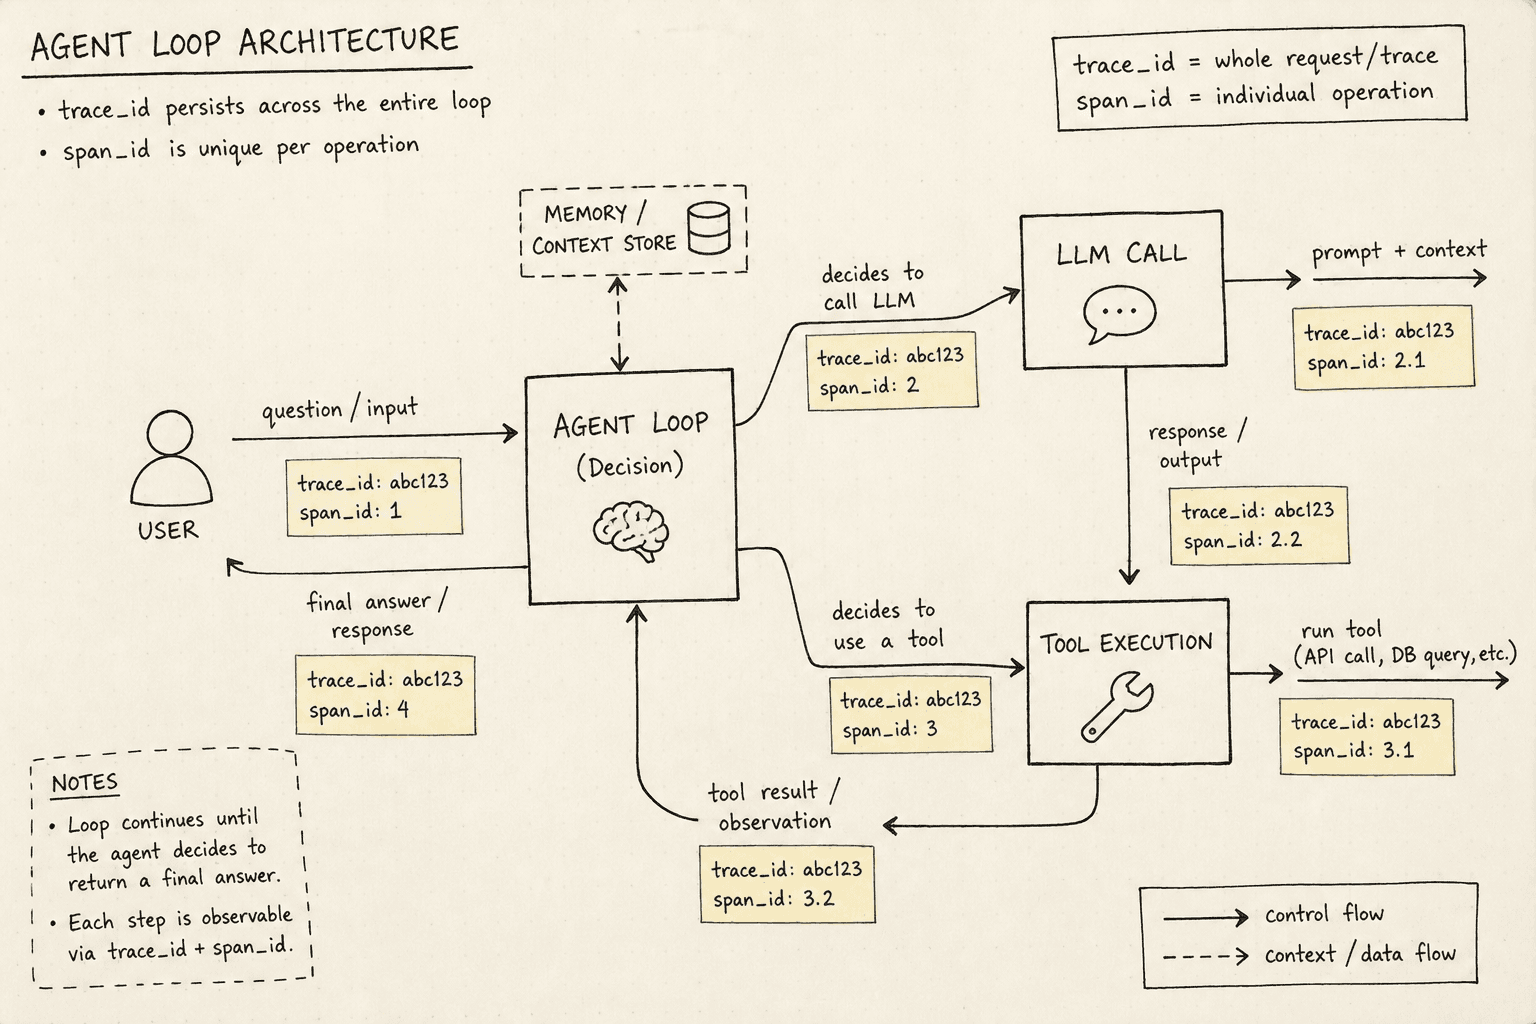
Consider a customer support agent. It receives a query, searches a knowledge base, finds a relevant article, summarizes the answer, and sends it back. In a traditional app, this is one request. In an agent, this is a sequence of events:
- Receive user input.
- Decide to call
search_knowledge_base. - Execute
search_knowledge_base("refund policy"). - Receive results.
- Decide to call
summarize_text. - Execute
summarize_text([...]). - Return final answer.
If you only log the start and end times, you have no insight into step 3 or 5. Did the search fail? Was the summary too short? Did the model decide incorrectly? You need a trace that captures each decision node.
In modern ai engineering, treating agents as simple endpoints is a common anti-pattern. The mechanism here is the Agent Loop. Each iteration of the loop is a span. The parent span is the overall agent invocation. Child spans are the individual LLM calls and tool executions. Without linking these, you cannot debug the "why." This requirement is central to the discipline of ai engineering.
The Logging Schema: Defining the Atomic Unit
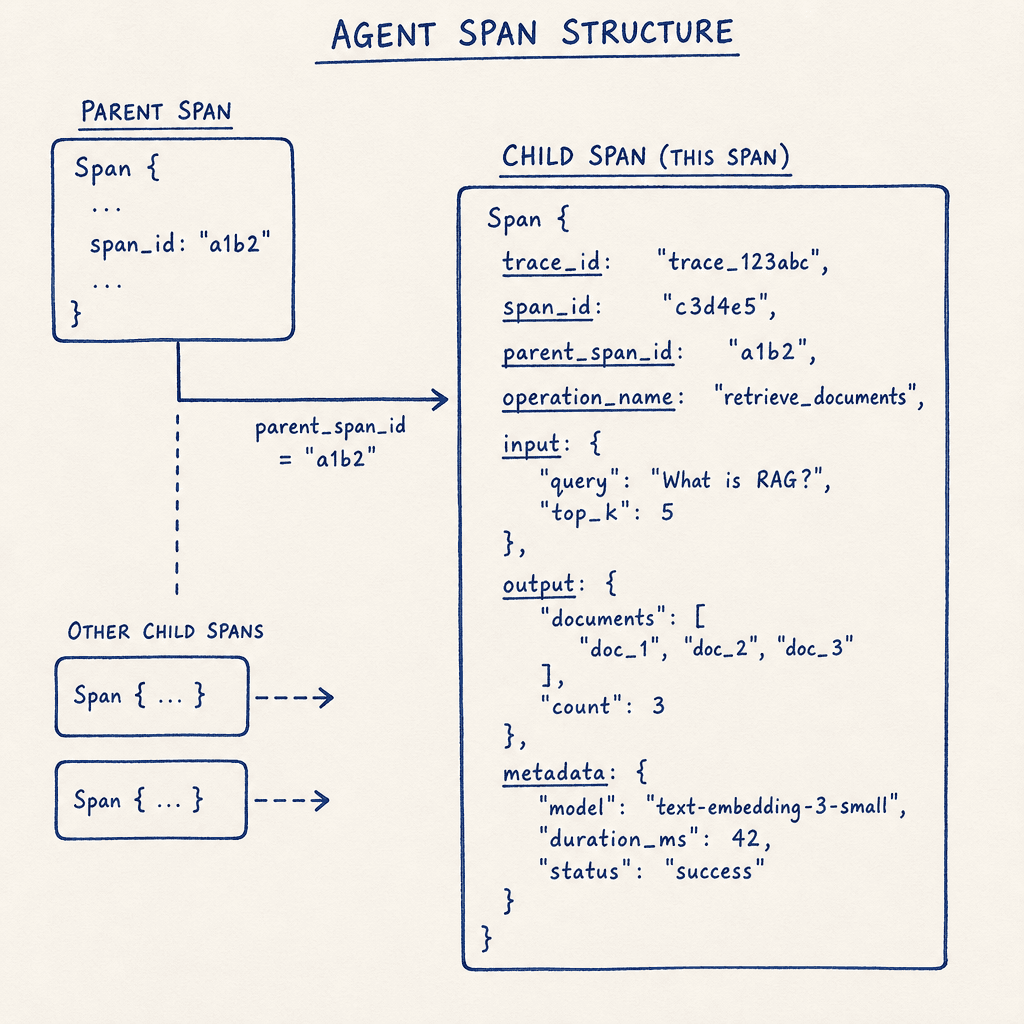
Defining a consistent schema is a cornerstone of scalable ai engineering. To build effective observability, you must define a consistent schema for every interaction. The atomic unit is the span. A span represents a single operation within the agent loop. For LLMs, this is typically a single model call. For tools, it is a single function execution.
Core Fields in an Agent Span
Every span should include the following fields, standardized wherever possible:
trace_id: A unique identifier for the entire agent session. This links all spans from a single user interaction.span_id: A unique identifier for this specific operation (e.g., this specific LLM call).parent_span_id: Links this span to its parent (e.g., the loop iteration that triggered this tool call).operation_name: Describes the action (e.g.,llm.chat,tool.search,agent.decide).input: The raw input to the operation. For LLMs, this is the prompt. For tools, this is the arguments.output: The raw output. For LLMs, this is the completion. For tools, this is the result.metadata: Structured data for analysis.
These fields ensure consistency across all ai engineering observability tools.
Essential Metadata for LLM Spans
When logging an LLM call, you must capture cost and performance metrics. These are critical for debugging and budgeting.
{
  // Note: cost_usd ($0.0009) is illustrative based on current pricing and may vary by region and model version.
  "trace_id": "abc-123",
  "span_id": "def-456",
  "operation_name": "llm.chat",
  "model_name": "gpt-4-turbo",
  "input_tokens": 150,
  "output_tokens": 45,
  "latency_ms": 1200,
  "cost_usd": 0.0009,
  "finish_reason": "stop",
  "temperature": 0.7
}
The input_tokens and output_tokens are non-negotiable. They allow you to calculate cost per trace and identify latency bottlenecks. The finish_reason helps distinguish between successful completions and truncated outputs (e.g., length), which often indicate prompt issues.
Essential Metadata for Tool Spans
Tool spans require different metadata because they involve I/O.
{
  "trace_id": "abc-123",
  "span_id": "ghi-789",
  "operation_name": "tool.search_knowledge_base",
  "tool_input": { "query": "refund policy" },
  "tool_output_length": 500,
  "latency_ms": 300,
  "status": "success"
}
Logging tool_output_length is a proxy for data volume. If a tool returns massive amounts of data, it may bloat the next prompt, increasing cost and latency. Monitoring this helps optimize prompt engineering.
Tracing and Correlation IDs
Correlation IDs are the glue that holds your observability together. Without them, spans are isolated data points. With them, you can reconstruct the agent’s thought process.
Propagating Trace Context
In a typical agent framework (like LangChain or LlamaIndex), the framework manages the loop. You must ensure that the trace_id is propagated to every nested call. This includes:
- LLM Providers: When calling OpenAI or Anthropic, pass the
trace_idin the metadata or custom headers if supported. - External APIs: When a tool calls an external service (e.g., a database or another API), inject the
trace_idinto the HTTP headers. This allows you to correlate agent actions with backend service logs. - Async Boundaries: Agents often use async operations. Ensure that the trace context is captured at the start of the async task and resumed correctly.
This is a critical step in robust ai engineering pipelines.
Visualizing the Trace
A good observability tool will visualize the trace as a tree. The root is the user query. Branches are the agent’s decisions. Leaves are the LLM calls and tool executions.
For example, a trace might look like this:
[Root] User Query: "Where is my order?"
  ├── [Span] Agent Decides: Call `get_order_status`
  │     └── [Span] Tool: `get_order_status(order_id="123")`
  │           └── [Span] External API: GET /orders/123
  ├── [Span] Agent Decides: Call `llm` with status
  │     └── [Span] LLM: Chat Completion (input: 200 tokens, output: 50 tokens)
Visualizing these traces is essential for effective ai engineering debugging. Without this hierarchy, you see a list of events. With it, you see the reasoning path. You can spot where the agent went wrong: Did it choose the wrong tool? Did it misinterpret the tool output? Did the LLM fail to summarize correctly?
Sampling and Cost Management
Effective ai engineering requires balancing observability depth with cost constraints. Agent observability can be expensive. If you log every token for every trace, your storage and processing costs will skyrocket. You need a sampling strategy.
Head-Based Sampling
Head-based sampling decides whether to sample a trace at the start. This is simple but risky. If you sample only 10% of traces, you might miss rare but critical failure modes that occur in the unsampled 90%.
Tail-Based Sampling
Tail-based sampling decides whether to keep a trace after the operation completes. This is more powerful for agents. You can define rules like:
- Always sample traces with errors or exceptions.
- Sample traces with high latency (> 5 seconds).
- Sample traces with high token counts (high cost).
- Randomly sample normal traces (e.g., 1%).
This ensures you capture all failures and expensive operations while reducing the volume of normal data.
Implementation Example
In a Python agent, you might implement a sampler that checks the trace at the end:
def should_sample(span):
    if span.status == "error":
        return True
    if span.latency_ms > 5000:
        return True
    if span.metadata.get("cost_usd", 0) > 0.01:
        return True
    return random.random() < 0.01  # 1% random sample
This code snippet demonstrates a practical approach for ai engineering teams. This strategy balances cost and insight. You sacrifice visibility into normal operations to gain deep visibility into failures and anomalies.
Conclusion
Agent observability is not an afterthought. It is a foundational requirement for building reliable AI applications. By defining a consistent logging schema, propagating correlation IDs, and implementing smart sampling, you can transform opaque agent behavior into transparent, debuggable processes.
Start small. Log every LLM call and tool execution with a consistent schema. Propagate trace IDs. Add sampling as your volume grows. The goal is not just to monitor performance, but to understand reasoning. When you can reconstruct the agent’s thought process, you can fix it, elevating your ai engineering practices.
Related posts
Tracing LLM Calls with OpenTelemetry
Learn how to implement OpenTelemetry for tracing LLM calls, improving observability and debugging in GenAI applications.
Why Your Agent Loops Forever (and Five Fixes)
Understand why AI agents enter infinite loops and learn five practical fixes for tool failures and debugging.
Testing and Debugging Non-Deterministic Agents
A practical guide to testing and debugging non-deterministic AI agents using trajectory replay, mocking, and strategies for flaky tests.
