Latency Metrics That Matter: TTFT, TPOT, and p99
An examination of key llm latency metrics including TTFT, TPOT, and p99 to help SREs optimize inference performance.
Part 6 of the LLM Inference from Scratch series.
In traditional REST APIs, latency is a scalar value: the time between sending a request and receiving the final response. For an SRE monitoring a login endpoint, the p99 latency tells the whole story. If the p99 is 200ms, the system is healthy. If it spikes to 2s, you have a problem.
Large Language Model (LLM) inference breaks this model. An LLM response is not a single blob; it is a continuous stream of tokens generated over seconds or minutes. A single "request" might take 3 seconds to start and 45 seconds to finish. Reporting a single aggregate latency metric obscures the underlying mechanics, making it impossible to distinguish between a slow initial processing step and a sluggish generation loop.
To optimize LLM inference, we must decompose latency into its constituent phases: Time To First Token (TTFT) and Time Per Output Token (TPOT). Understanding these metrics, and how they interact with percentile distributions like p99, is critical for capacity planning and debugging.
The Two-Phase Mechanism
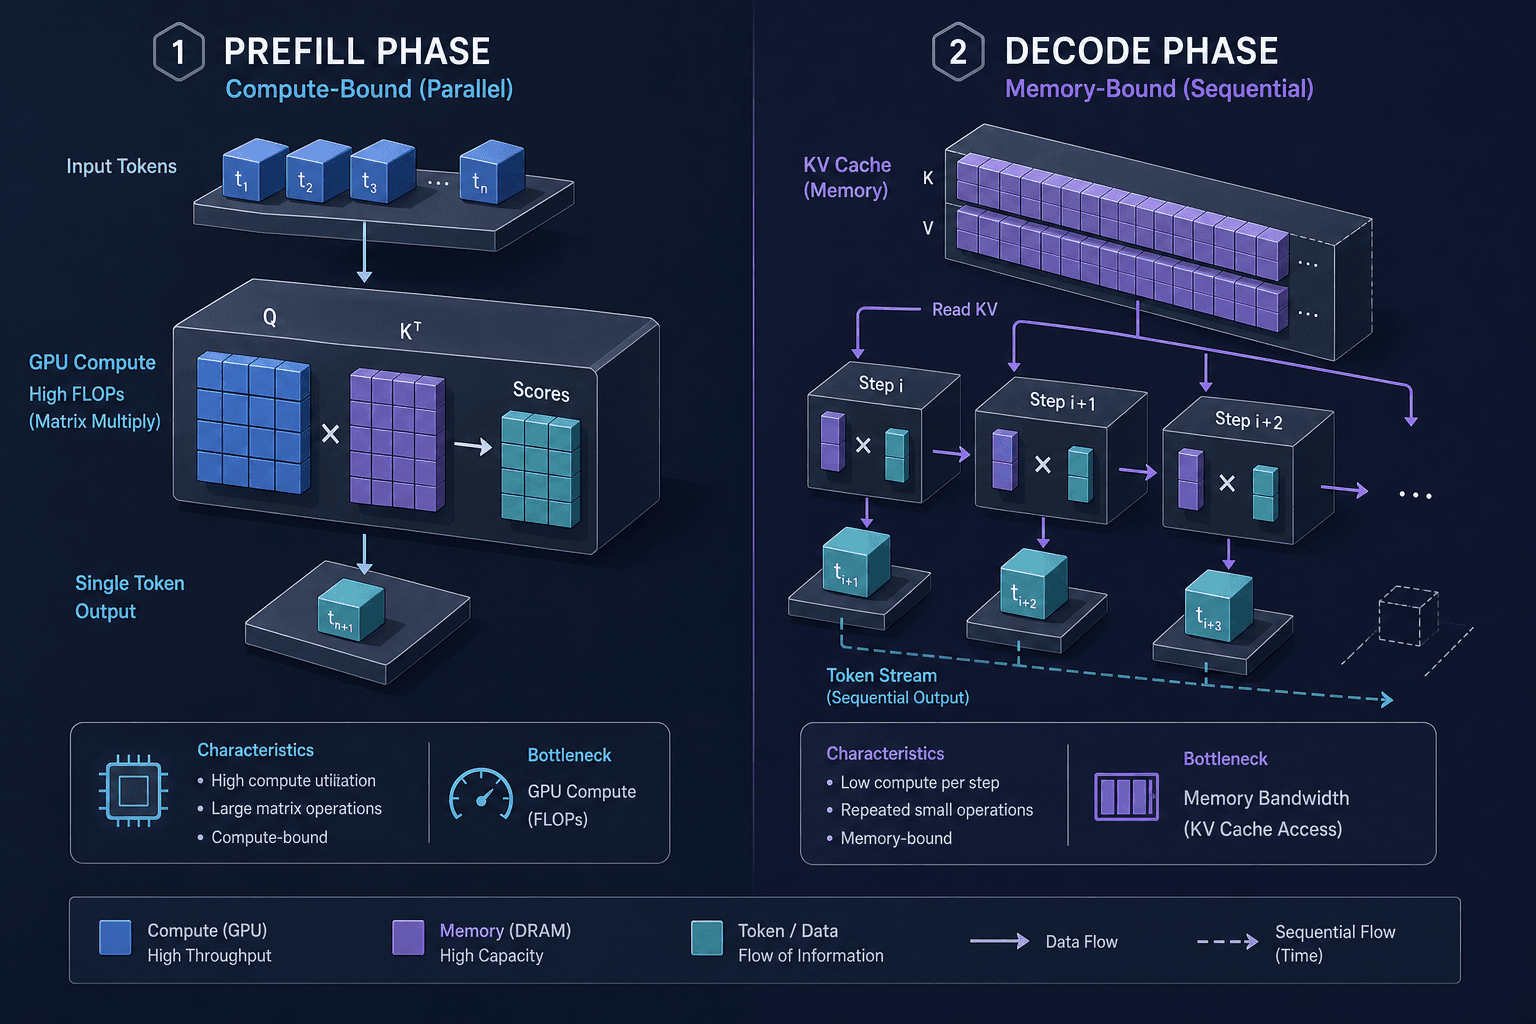
Before defining metrics, we must understand the mechanism. LLM inference consists of two distinct computational phases, each with different resource constraints. As detailed in the vLLM architecture documentation, these phases exhibit fundamentally different performance characteristics.
- Prefill Phase (Compute-Bound): The model processes the entire input prompt (the context window) in parallel. This is a matrix multiplication-heavy operation. The GPU is fully utilized, but it must wait for the entire prompt to be processed before generating the first token.
- Decode Phase (Memory-Bound): The model generates one token at a time. For each new token, the model must attend to all previous tokens (key-value cache). This operation is small and cannot be easily parallelized across tokens. The bottleneck shifts from GPU compute to memory bandwidth. The GPU spends most of its time waiting for data to move from VRAM to the compute units.
This distinction is crucial. In our experience optimizing a high-throughput chat service, we observed that tuning batch size without separating these metrics led to false conclusions about GPU saturation. Optimizing for the prefill phase (TTFT) often involves different strategies than optimizing for the decode phase (TPOT).
TTFT: The Perception of Responsiveness
Time To First Token (TTFT) is the elapsed time from when the request is received by the inference engine to when the first token of the response is generated and streamed back to the client.
TTFT represents the latency of the prefill phase. It is the primary driver of perceived responsiveness. If a user submits a query and waits 5 seconds for the first word to appear, the system feels "slow," regardless of how fast subsequent tokens appear.
Why TTFT Matters
TTFT is sensitive to batch size and queueing. When multiple requests arrive simultaneously, the inference engine (e.g., vLLM, TGI) groups them into a batch. The batch size determines how much parallel work is done during prefill.
- Small Batch: Low TTFT, but lower overall throughput.
- Large Batch: Higher TTFT because the engine waits for slower requests in the batch to finish prefill before starting generation. However, it maximizes GPU utilization during the decode phase.
TPOT: The Cost of Generation
Time Per Output Token (TPOT), also known as Inter-Token Latency, is the average time taken to generate each subsequent token after the first one.
TPOT, also known as inter-token latency, represents the latency of the decode phase. Since the decode phase is memory-bound, TPOT is largely determined by the hardware's memory bandwidth and the efficiency of the key-value (KV) cache management.
Why TPOT Matters
For long outputs, TPOT dominates the total latency. If TTFT is 2 seconds and TPOT is 100ms/token, a 100-token response takes 2 + (100 * 0.1) = 12 seconds. A 1000-token response takes 2 + (1000 * 0.1) = 102 seconds. The TTFT becomes negligible.
Optimizing TPOT involves:
- KV Cache Optimization: Using techniques like PagedAttention (vLLM) to avoid memory fragmentation.
- Quantization: Reducing precision (e.g., FP16 to INT8) to reduce memory footprint and increase bandwidth efficiency.
- Speculative Decoding: Using a smaller model to propose tokens and a larger model to verify them, effectively hiding decode latency.
The p99 Problem: Why Averages Lie
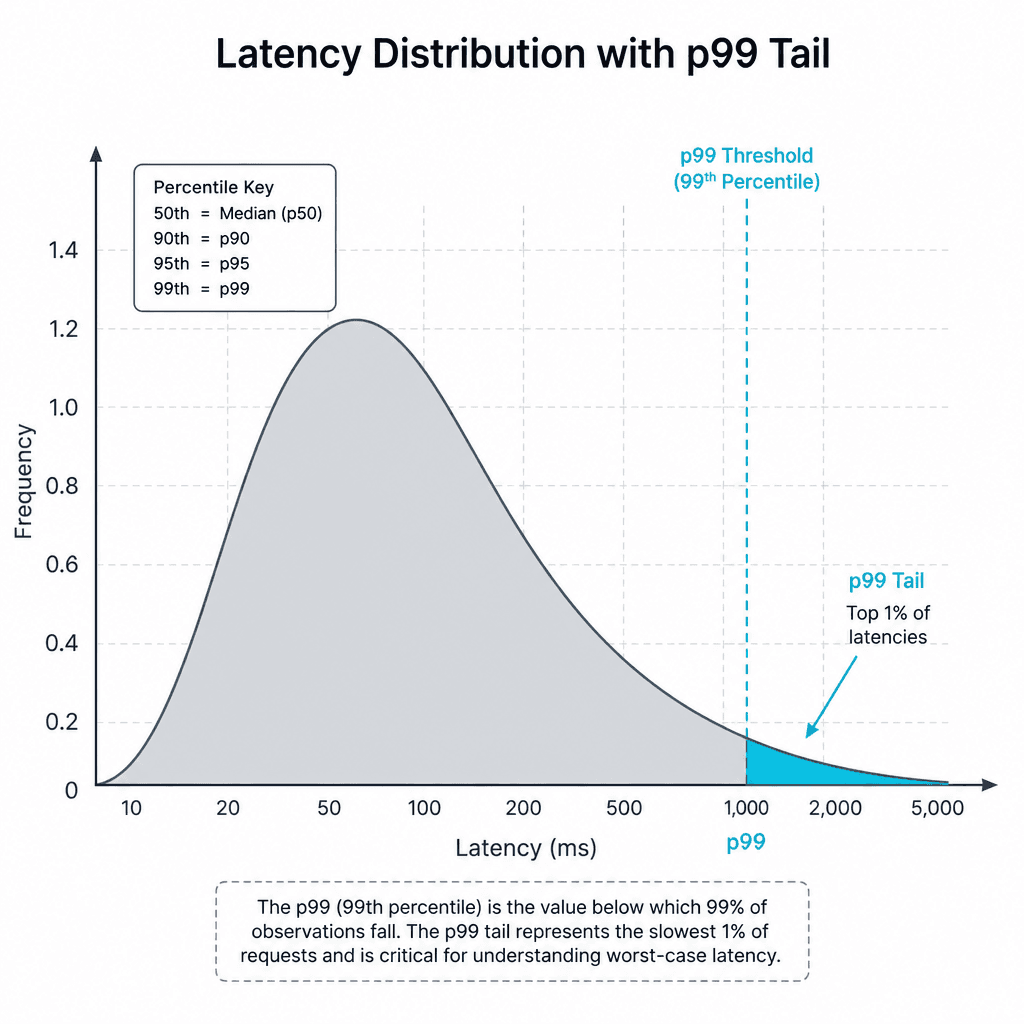
Monitoring tools often report p99 latency. In the context of LLMs, a single p99 metric is misleading. You need to track p99 TTFT and p99 TPOT separately.
Scenario: The Mixed Workload
Imagine a service handling both short queries (10 tokens) and long queries (500 tokens).
- Request A: 10 tokens. TTFT: 500ms. TPOT: 50ms. Total: ~1s.
- Request B: 500 tokens. TTFT: 500ms. TPOT: 50ms. Total: ~25.5s.
If you report a single p99 latency, you might see 25.5s. But this number doesn't tell you why it was slow. Was it a slow prefill? Or a slow decode?
By tracking p99 TTFT and p99 TPOT:
- p99 TTFT: 600ms. This tells you the prefill pipeline is healthy.
- p99 TPOT: 60ms. This tells you the decode pipeline is experiencing memory pressure or GC pauses.
If p99 TTFT spikes, you likely have queueing issues (too many concurrent requests). If p99 TPOT spikes, you likely have hardware saturation or inefficient KV cache usage. Ensure your llm slo definitions align with these decomposed metrics to avoid masking underlying infrastructure issues.
Optimization Tradeoffs: The Batch Size Lever
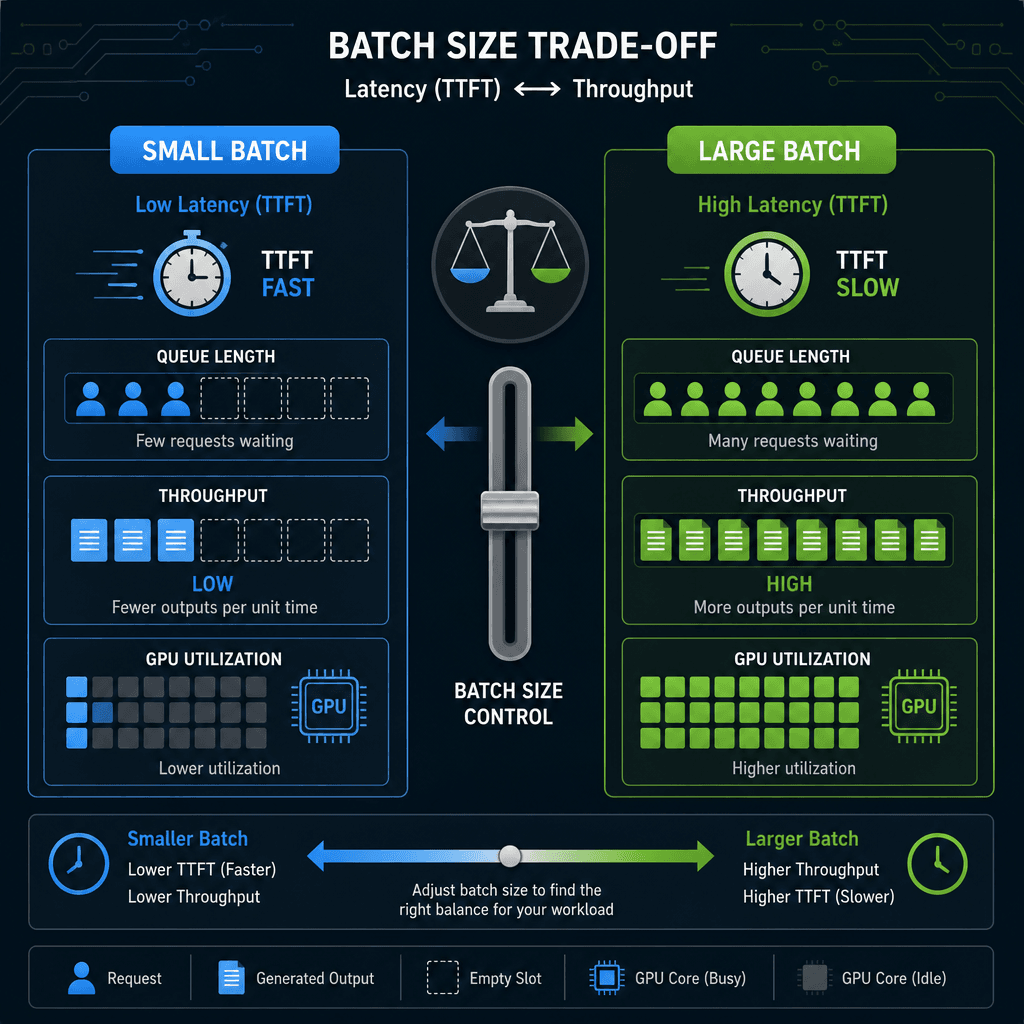
The primary lever for SREs is max batch size. Changing this parameter creates a direct tradeoff between TTFT and throughput.
-
Increasing Max Batch Size:
- Effect on TTFT: Increases. Requests wait longer in the queue to be grouped into a large batch. The prefill phase becomes more efficient (better compute utilization), but the start time is delayed.
- Effect on TPOT: Decreases (improves). Larger batches allow the GPU to process more tokens in parallel during the decode phase, amortizing the memory access cost.
- Risk: If the batch size is too large, TTFT becomes unacceptable, leading to user timeout errors.
-
Decreasing Max Batch Size:
- Effect on TTFT: Decreases. Requests are processed faster, reducing queueing latency.
- Effect on TPOT: Increases (worsens). The GPU is underutilized during decode, leading to higher per-token latency.
- Risk: Lower overall throughput. The system handles fewer requests per second.
Concrete Example
Consider a deployment on an A10G GPU.
{
  "config_a": {
    "batch_size": 4,
    "p99_ttft_ms": 200,
    "p99_tpot_ms": 80,
    "throughput_req_s": 50
  },
  "config_b": {
    "batch_size": 32,
    "p99_ttft_ms": 800,
    "p99_tpot_ms": 40,
    "throughput_req_s": 150
  }
}
Note: The JSON config keys (batch_size, p99_ttft_ms, etc.) are illustrative examples and do not map directly to standard inference engine configurations (e.g., vLLM's max_num_seqs or TGI's max_batch_total_tokens). Use these values only to conceptualize the trade-offs.
If your SLA requires TTFT < 500ms, Config B is invalid, even though it has better throughput and TPOT. You must tune batch size to meet the TTFT constraint, then accept the resulting TPOT and throughput.
Conclusion
LLM latency is not a single metric. It is a composite of prefill and decode performance. By tracking TTFT and TPOT separately, SREs can identify whether bottlenecks are compute-bound (prefill) or memory-bound (decode). This granularity allows for targeted optimizations, such as adjusting batch sizes, implementing KV cache pruning, or selecting appropriate quantization schemes, rather than guessing based on aggregate latency numbers.
The p99 metric remains essential, but only when applied to TTFT and TPOT individually. This approach transforms latency monitoring from a reactive alarm system into a diagnostic tool for inference engine tuning.
Common Pitfalls
When implementing these metrics, SREs often fall into specific traps:
- Ignoring p99 TPOT: Focusing only on TTFT can lead to severe latency spikes for long-running generations, as p99 TPOT may degrade significantly under load even if TTFT remains stable.
- Misinterpreting Average Latency: Averages hide the tail. An average latency of 200ms might mask a p99 of 5 seconds, which is unacceptable for interactive applications.
- Assuming Linear Scaling: Increasing batch size does not always improve throughput linearly due to memory bandwidth limits and KV cache overheads.
Practical Takeaways
- Decompose Your Metrics: Never rely on aggregate latency. Instrument and alert on p99 TTFT and p99 TPOT separately.
- Tune Batch Size Carefully: Use batch size as the primary lever to balance TTFT and throughput, but monitor TPOT to ensure memory bandwidth isn't saturated.
- Validate Against SLAs: Define your SLOs based on TTFT for responsiveness and TPOT for generation speed, not just total request time.
FAQ
Q: Can I use average latency to monitor LLM performance? A: No. Average latency masks the long-tail behavior that users actually experience. Always use percentiles like p95 or p99, and decompose them into TTFT and TPOT.
Q: How does p99 TPOT differ from p99 TTFT? A: p99 TTFT measures the delay before the first token appears (prefill phase), while p99 TPOT measures the time between subsequent tokens (decode phase). They are affected by different bottlenecks: queueing/compute vs. memory bandwidth.
Q: Why is my p99 TPOT high even with low batch sizes? A: High p99 TPOT at low batch sizes often indicates hardware saturation, such as memory bandwidth limits, or inefficient KV cache management (e.g., fragmentation). Check your GPU memory utilization and consider optimization techniques like PagedAttention.
Related posts
Building an LLM Load Test That Reflects Real Traffic
A guide to building LLM load tests that reflect real traffic patterns using capacity planning, arrival rates, and saturation metrics.
Prefix Caching in vLLM: When It Wins and When It Doesn't
An examination of prefix caching in vLLM, analyzing when automatic prefix caching improves TTFT and cache hit rates, and when it may not provide benefits.
Prefill vs Decode: The Two Halves of Every LLM Request
An examination of the prefill and decode phases in LLM inference, analyzing how TTFT, memory bandwidth, and compute bounds affect performance.
